OPEN-SOURCE SCRIPT
已更新 Tracking Lines with TP/SL + Labels at Left
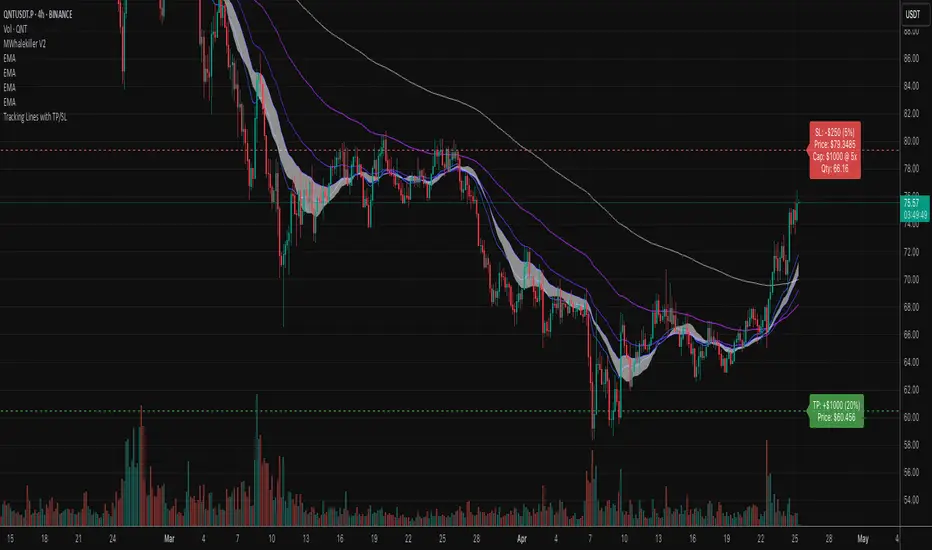
A simple indicator so you can set your TP and SL tolerance along with capital and leverage.
A red line and green line will represent where current TP and SL would be on the chart along with the number of tokens you need to trade to meet the USD capital to be trades.
Just gives a visual representation of SL to key zones on the chart so you can judge scalp entries a little better :)
A red line and green line will represent where current TP and SL would be on the chart along with the number of tokens you need to trade to meet the USD capital to be trades.
Just gives a visual representation of SL to key zones on the chart so you can judge scalp entries a little better :)
發行說明
This indicator plots dynamic Take Profit (TP) and Stop Loss (SL) levels based on customizable percentages above and below the current price. It calculates and displays:Your total trade value based on capital and leverage
The dollar amount you stand to gain (TP) or lose (SL)
The number of tokens/contracts needed at current price
Fully customisable label colours and opacity for clean visuals
Ideal for quickly visualising profit/loss zones and managing risk with precision.
發行說明
This indicator plots dynamic Take Profit (TP) and Stop Loss (SL) levels based on customizable percentages above and below the current price. It calculates and displays:Your total trade value based on capital and leverage
The dollar amount you stand to gain (TP) or lose (SL)
The number of tokens/contracts needed at current price
Fully customizable label colors and opacity for clean visuals
Ideal for quickly visualizing profit/loss zones and managing risk with precision.
開源腳本
秉持TradingView一貫精神,這個腳本的創作者將其設為開源,以便交易者檢視並驗證其功能。向作者致敬!您可以免費使用此腳本,但請注意,重新發佈代碼需遵守我們的社群規範。
免責聲明
這些資訊和出版物並非旨在提供,也不構成TradingView提供或認可的任何形式的財務、投資、交易或其他類型的建議或推薦。請閱讀使用條款以了解更多資訊。
免責聲明
這些資訊和出版物並非旨在提供,也不構成TradingView提供或認可的任何形式的財務、投資、交易或其他類型的建議或推薦。請閱讀使用條款以了解更多資訊。