OPEN-SOURCE SCRIPT
已更新 Flexi MA Heat Zones

Overview
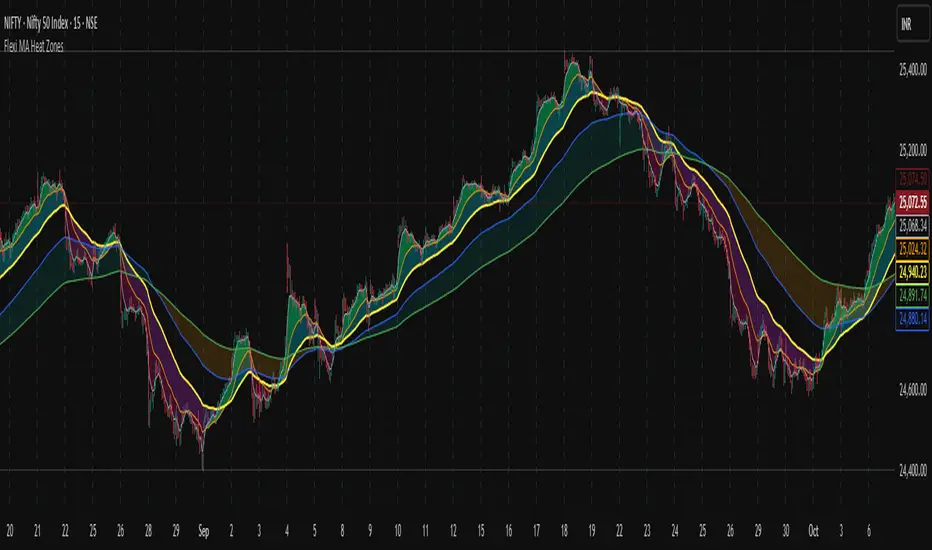
Flexi MA Heat Zones is a powerful multi-timeframe visualization tool that helps traders easily identify trend strength, direction, and potential zones of confluence using multiple moving averages and dynamic heatmaps. The indicator plots up to three pairs of customizable moving averages, with color-coded heat zones to highlight bullish and bearish conditions at a glance.
Whether you're a trend follower, mean-reversion trader, or looking for visual confirmation zones, this indicator is designed to offer deep insights with high customizability.
⚙️ Key Features
🔄 Supports multiple MA types: Choose from EMA, SMA, WMA, VWMA to suit your strategy.
🎯 Six moving averages: Three MA pairs (MA1-MA2, MA3-MA4, MA5-MA6), each with independent lengths and colors.
🌈 Heatmap Zones: Dynamic fills between MA pairs, changing color based on bullish or bearish alignment.
👁️🗨️ Full customization: Enable/disable any MA pair and its heatmap zone from the settings.
🪞 Transparency controls: Adjust the visibility of heat zones for clarity or stylistic preference.
🎨 Color-coded for clarity: Bullish and bearish colors for each heat zone pair, fully user-configurable.
🧩 Efficient layout: Smart use of grouped inputs for easier configuration and visibility management.
📈 How to Use
Use the MA1–MA2 and MA3–MA4 zones for longer-term trend tracking and confluence analysis.
Use the faster MA5–MA6 zone for short-term micro-trend identification or scalping.
When a faster MA is above the slower one within a pair, the fill turns bullish (user-defined color).
When the faster MA is below the slower one, the fill turns bearish.
Combine with price action or other indicators for entry/exit confirmation.
🧠 Pro Tips
For trend-following strategies, consider using EMA or WMA types.
For mean-reversion or support/resistance zones, SMA and VWMA may offer better zone clarity.
Overlay with RSI, MACD, or custom entry signals for higher confidence setups.
Use different heatmap transparencies to visually separate overlapping MA zones.
發行說明
Flexi MA Heat Zones — Smart Trend VisualizationVersion: Upgraded Edition (2025)
🆕 What’s New in This Version
✨ Fully customizable 5-MA framework with flexible type selection (EMA, SMA, WMA, VWMA)
🌈 Enhanced multi-zone heatmaps with independent transparency control
🔧 New global toggle — disable all heatmaps while keeping MA lines visible
🟡 50 MA as the trend anchor, giving a clearer picture of long-term trend direction
💡 Description
Flexi MA Heat Zones converts your chart’s moving averages into a clear, color-coded map of market direction.
At a single glance, you can identify if the market is bullish, bearish, or consolidating — thanks to intuitive heatmap zones between MA pairs.
The indicator visually blends momentum and trend, making it effortless to read price structure.
With the 50 MA as its core trend decider, this version offers a perfect balance between short-, medium-, and long-term trend tracking.
🧠 Key Features
🔹 5 Moving Averages — choose type (EMA, SMA, WMA, VWMA)
🔹 Dynamic Heat Zones — highlight bullish and bearish phases instantly
🔹 Independent Transparency Controls for all heatmaps
🔹 Always-visible MA lines for consistent structure visibility
🔹 One-click Global Heatmap Toggle
🔹 Clear Trend Recognition:
MA1 > MA2 → Short-term Bullish Zone
MA1 < MA2 → Short-term Bearish Zone
Flat overlap → Sideways or consolidation
⚙️ How to Use
Use MA1 & MA2 (e.g., 20–50) for short- to mid-term momentum
Use MA3 & MA4 (e.g., 100–200) for long-term trend context
Use MA5 (e.g., 5) to detect early shifts or exhaustion zones
The 50 MA (default for MA2) acts as the trend decision layer — when price crosses or consolidates near it, expect potential trend transitions.
💬 Pro Tip
Pair this indicator with Volume, RSI, or Price Action signals to confirm breakout strength and trend continuation.
開源腳本
秉持TradingView一貫精神,這個腳本的創作者將其設為開源,以便交易者檢視並驗證其功能。向作者致敬!您可以免費使用此腳本,但請注意,重新發佈代碼需遵守我們的社群規範。
免責聲明
這些資訊和出版物並非旨在提供,也不構成TradingView提供或認可的任何形式的財務、投資、交易或其他類型的建議或推薦。請閱讀使用條款以了解更多資訊。
開源腳本
秉持TradingView一貫精神,這個腳本的創作者將其設為開源,以便交易者檢視並驗證其功能。向作者致敬!您可以免費使用此腳本,但請注意,重新發佈代碼需遵守我們的社群規範。
免責聲明
這些資訊和出版物並非旨在提供,也不構成TradingView提供或認可的任何形式的財務、投資、交易或其他類型的建議或推薦。請閱讀使用條款以了解更多資訊。