PROTECTED SOURCE SCRIPT
CRT |TG|
CRT |TG| - Central Range Theory Breakout Indicator
Hello Traders!
This indicator is built on the Central Range Theory (CRT) concept. It tracks the high/low levels from previous periods in volatile markets (Forex, Crypto, Stocks) and generates "sweep" signals when price breaks these levels (breakout). It's compatible with ICT (Inner Circle Trader) strategies and helps identify reversal or continuation setups.
Thanks to the original development team—we've just added timezone flexibility and user-friendly settings!
Key Features
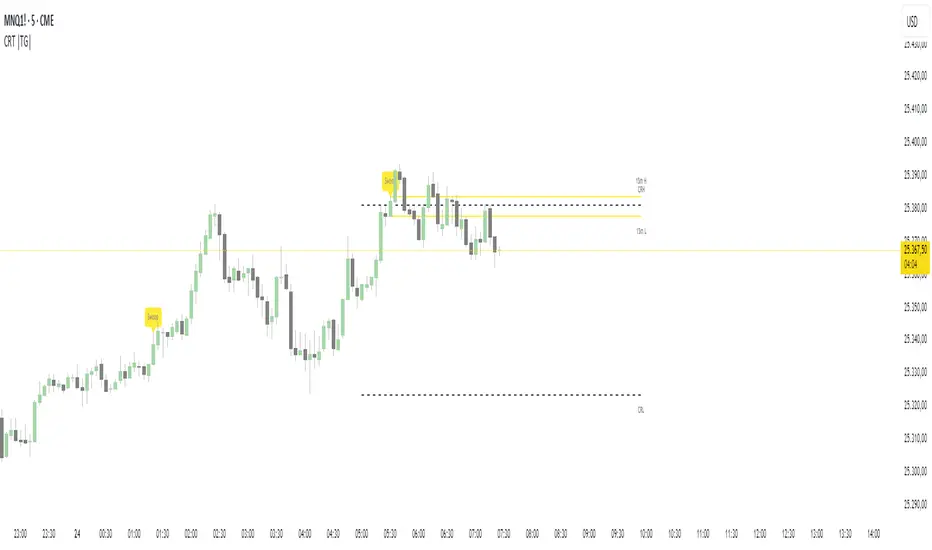
Period Detection: Calculates period starts based on your selected timeframe (1 Hour or 4 Hour). At the start of each new period, it draws horizontal lines for the previous period's highest (CRH) and lowest (CRL) levels.
Breakout Detection: When price closes above CRH (upward breakout) or below CRL (downward breakout), it draws new levels based on the current bar's high/low ("15m H/L" labels).
Additionally, it adds a "Sweep" label on the breakout bar—to highlight liquidity sweeps (ideal for filtering false breakouts).
Visual Cleanliness: Lines extend rightward (30 bars ahead), labels are tiny, and the deletion mechanism keeps the chart uncluttered.
Timezone Support: Added popular named timezones for global users (DST handled automatically). Default is UTC—independent of your broker's time.
Usage Tips
Strategy Integration: Treat CRH/CRL as support/resistance. Use 15m H/L post-breakout for trailing stops. Filter with volume or RSI (add other indicators).
Test It: Backtest across timezones. High volatility in crypto (BTCUSDT) yields more signals; quieter forex hours reduce false ones.
Disclaimer: This indicator is for educational purposes. Always use risk management in live trading—past performance doesn't guarantee future results.
Hello Traders!
This indicator is built on the Central Range Theory (CRT) concept. It tracks the high/low levels from previous periods in volatile markets (Forex, Crypto, Stocks) and generates "sweep" signals when price breaks these levels (breakout). It's compatible with ICT (Inner Circle Trader) strategies and helps identify reversal or continuation setups.
Thanks to the original development team—we've just added timezone flexibility and user-friendly settings!
Key Features
Period Detection: Calculates period starts based on your selected timeframe (1 Hour or 4 Hour). At the start of each new period, it draws horizontal lines for the previous period's highest (CRH) and lowest (CRL) levels.
Breakout Detection: When price closes above CRH (upward breakout) or below CRL (downward breakout), it draws new levels based on the current bar's high/low ("15m H/L" labels).
Additionally, it adds a "Sweep" label on the breakout bar—to highlight liquidity sweeps (ideal for filtering false breakouts).
Visual Cleanliness: Lines extend rightward (30 bars ahead), labels are tiny, and the deletion mechanism keeps the chart uncluttered.
Timezone Support: Added popular named timezones for global users (DST handled automatically). Default is UTC—independent of your broker's time.
Usage Tips
Strategy Integration: Treat CRH/CRL as support/resistance. Use 15m H/L post-breakout for trailing stops. Filter with volume or RSI (add other indicators).
Test It: Backtest across timezones. High volatility in crypto (BTCUSDT) yields more signals; quieter forex hours reduce false ones.
Disclaimer: This indicator is for educational purposes. Always use risk management in live trading—past performance doesn't guarantee future results.
受保護腳本
此腳本以閉源形式發佈。 不過,您可以自由且不受任何限制地使用它 — 在此處了解更多資訊。
免責聲明
這些資訊和出版物並不意味著也不構成TradingView提供或認可的金融、投資、交易或其他類型的意見或建議。請在使用條款閱讀更多資訊。
免責聲明
這些資訊和出版物並不意味著也不構成TradingView提供或認可的金融、投資、交易或其他類型的意見或建議。請在使用條款閱讀更多資訊。