OPEN-SOURCE SCRIPT
已更新 Mayer Multiple

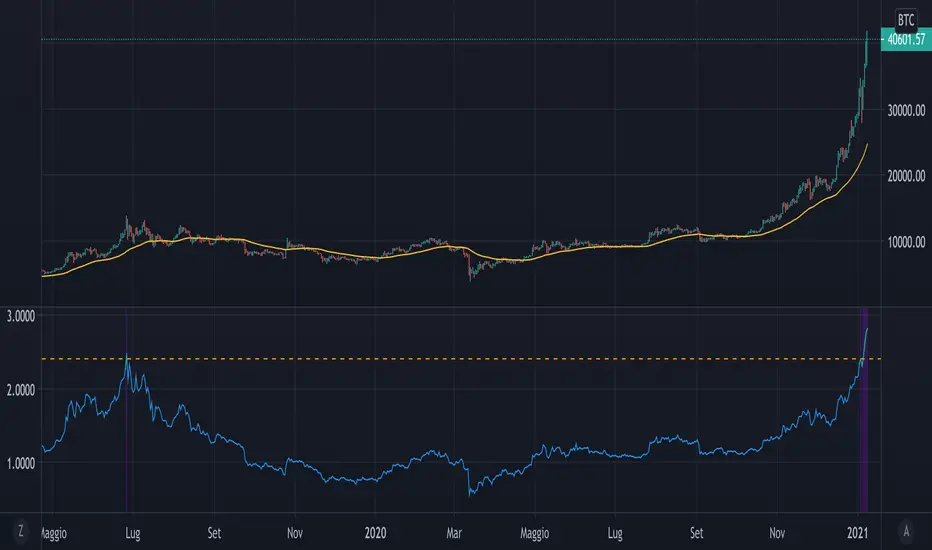
The script implements a custom version of the Mayer multiple and it may be useful for analyzing the price of Bitcoin in a historical context.
Note n.1: Mayer multiple does not tell whether to buy, sell or hold, but highlights the best long-term area when the bitcoin price is below a threshold value (2.4).
Note n.2: the threshold value (2.4) has been determined in the past by simulations performed.
The script user may decide whether to use the shown graph or another graph for the calculation of the Mayer multiple.
The script is very easy to use and it is possible to change the following parameters:
- the period of SMA (default value is 200)
- the threshold (default value 2.4)
- Show or not the sell area
- Use or not the shown graph to calculate the Mayer multiple (default value is true)
- name of exchange to use for calculation of the Mayer multiple (default value is BNC)
- name of chart to use for calculation of the Mayer multiple (default value is BLX)
發行說明
- Added the alert conditions. Remember: the alertcondition statement does not start alerts but creates the conditions. The alerts must always be created manually in the Create Alert dialog box.
- Changed the precision of graph (from 2 to 4).
發行說明
Modified the title script.發行說明
- Modified the alert conditions name.
- The Mayer multiple's graph is now plotted in another panel.
發行說明
Improved the code readability.開源腳本
秉持TradingView一貫精神,這個腳本的創作者將其設為開源,以便交易者檢視並驗證其功能。向作者致敬!您可以免費使用此腳本,但請注意,重新發佈代碼需遵守我們的社群規範。
免責聲明
這些資訊和出版物並非旨在提供,也不構成TradingView提供或認可的任何形式的財務、投資、交易或其他類型的建議或推薦。請閱讀使用條款以了解更多資訊。
開源腳本
秉持TradingView一貫精神,這個腳本的創作者將其設為開源,以便交易者檢視並驗證其功能。向作者致敬!您可以免費使用此腳本,但請注意,重新發佈代碼需遵守我們的社群規範。
免責聲明
這些資訊和出版物並非旨在提供,也不構成TradingView提供或認可的任何形式的財務、投資、交易或其他類型的建議或推薦。請閱讀使用條款以了解更多資訊。