OPEN-SOURCE SCRIPT
已更新 Smoothed Candle Averages- NovaTheMachine
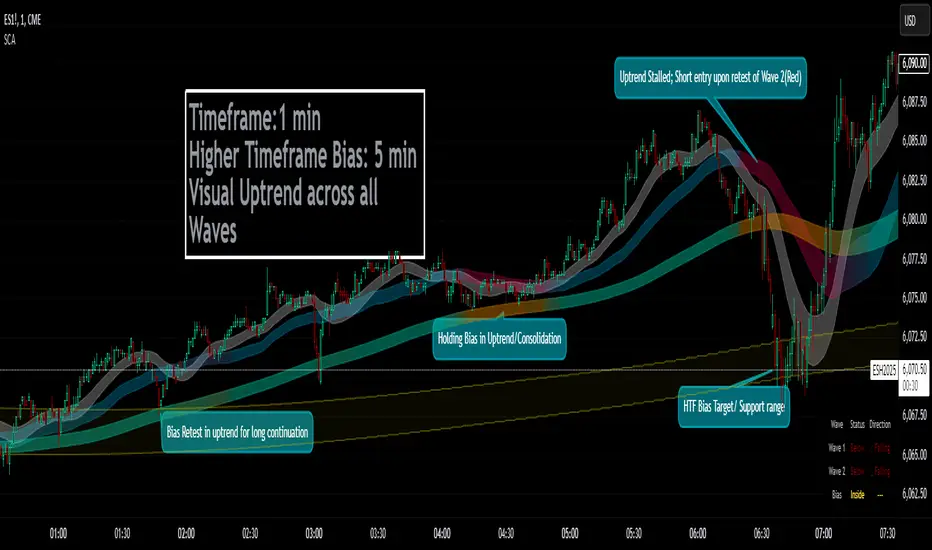
This script utilizes a series of moving averages that the user is able to change as they see fit for their own use.
The averages plotted for the first 2 waves are the High-Low rays of the selected period of time with the chosen moving average style.
The Bias is the Heikin Ashi High-Low ray plotted over the chosen time period, while the Secondary Bias is a higher Timeframe Bias for the same period of time on a selected higher timeframe.
The visuals for each ray are able to be changed to either; lines, solid wave, or dynamic wave.
The Dynamic waves will change color according to the total dissection and utilize the Min-Max range selected as a weight for the strength of the trend. Thus providing an at-a-glance overview of the price relative to trend.
The key objective with this script is to gauge the longer term trend with the current price action, to establish patterns and determine strength of moves both away from and towards the moving average/bias.
When both waves are trending with the Bias, it can be reasoned that there is a strong trend established, when waves and Bias are mixed or trending sideways it can be reasoned there is a range forming or potential for a direction change. When price has broken the waves and biases we can reasonably assume that a new trend has been formed, using the waves and biases again to determine the strength and length of the trend.
The Table will display whether the current price is above or below each wave, and whether the price is continuing or retracing. The Signals plotted are used to help identify when price has broken a wave more swiftly.
發行說明
This script utilizes a series of moving averages, to plot the selected averages as a High/Low Ray. Users can select from an assortment of Average Types as well as lookback periods.The Bias is the High-Low ray of Heikin Ashi Candles, the Secondary Bias is the same as the Primary Bias, however it allows the user to designate a higher timeframe to provide greater context on a lower timeframe chart. All timeframes and lookback periods can be modified by the user as well.
The visuals for each ray are able to be changed to either; lines, solid waves, or dynamic waves.
The Dynamic waves will change color according to the total dissection and utilize the Min-Max range selected as a weight for the strength of the trend. Thus providing an at-a-glance overview of the price relative to trend.
The strength calculation utilized in the dynamic wave fill is an original concept I created to help visualize the momentum gain or loss of dozens of averages without cluttering the chart by individually plotting each. The dissection value will determine how many averages to calculate between the Min and Max Range values, which are Simple Moving Averages.
- Example settings;
Dissection: 20
Min: 10
Max: 55
With these settings, we calculate 20 Simple Moving Averages between SMA10 and SMA55, and determine if the sum of all averages calculated is rising or falling and normalize that number between -1 (strong downtrend) and +1 (strong uptrend). The more moving averages that are trending in the same direction, the stronger the signal.
The key objective with this script is to gauge the longer term trend with the current price action, to establish patterns and determine strength of moves both away from and towards the moving average/bias.
When both waves are trending with the Bias, it can be reasoned that there is a strong trend established, when waves and Bias are mixed or trending sideways it can be reasoned there is a range forming or potential for a direction change. When price has broken the waves and biases we can reasonably assume that a new trend has been formed, using the waves and biases again to determine the strength and length of the trend.
The Table will display whether the current price is above or below each wave, and whether the price is continuing or retracing. The Signals plotted are used to help identify when price has broken a wave more swiftly.
Methods for determining directional entries;
- When all Waves are trending directionally, trade with that direction
- Watch for Directional weakness, as identified by the shorter lookback period wave crossing under the longer period waves
- Wait for a clean break of the trend/waves and enter with lower risk on a retest of the Waves previously broken (Break & Retest Method)
- Consider the Waves to act as levels of support and resistance, targeting them for entries, profit targets, or even stop-loss distances
- Avoid trading when waves are mixed, or trending sideways
- Identify directional breakouts with ease
- Visualize rising and falling support and resistance levels
- Gauge strength of trends using dynamic colored waves
- Lower timeframes for scalping intra-day moves
- Higher timeframes for swing trading
開源腳本
秉持TradingView一貫精神,這個腳本的創作者將其設為開源,以便交易者檢視並驗證其功能。向作者致敬!您可以免費使用此腳本,但請注意,重新發佈代碼需遵守我們的社群規範。
Head over to my YouTube page for step-by-step instructions on how to use indicators, all of their functions and more!
免責聲明
這些資訊和出版物並非旨在提供,也不構成TradingView提供或認可的任何形式的財務、投資、交易或其他類型的建議或推薦。請閱讀使用條款以了解更多資訊。
開源腳本
秉持TradingView一貫精神,這個腳本的創作者將其設為開源,以便交易者檢視並驗證其功能。向作者致敬!您可以免費使用此腳本,但請注意,重新發佈代碼需遵守我們的社群規範。
Head over to my YouTube page for step-by-step instructions on how to use indicators, all of their functions and more!
免責聲明
這些資訊和出版物並非旨在提供,也不構成TradingView提供或認可的任何形式的財務、投資、交易或其他類型的建議或推薦。請閱讀使用條款以了解更多資訊。