OPEN-SOURCE SCRIPT
VWAP, MFI, RSI with S/R Strategy

Best for 0dte/intraday trading on  SPY with 1 minute chart
Strategy Concept
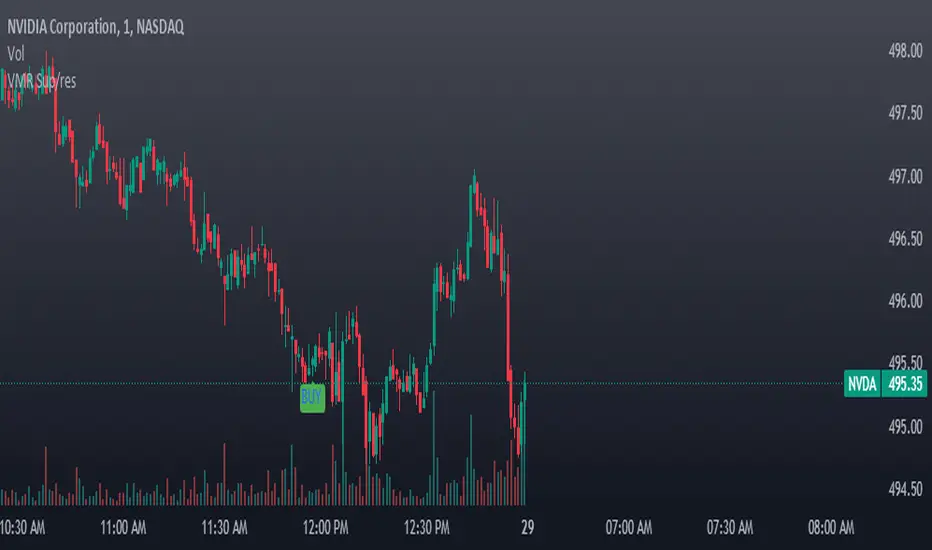
This strategy aims to identify potential reversal points in a price trend by combining momentum indicators (RSI and MFI), volume-weighted price (VWAP), and recent price action trends. It looks for conditions where the price is poised to change direction, either bouncing off a support level in a potential uptrend or falling from a resistance level in a potential downtrend.
By incorporating both price level analysis (support/resistance) and momentum indicators, the strategy seeks to increase the likelihood of identifying significant trend reversals, taking into consideration both recent price movements and the current price's position relative to historical highs and lows.
VWAP (Volume-Weighted Average Price)
MFI (Money Flow Index) and RSI (Relative Strength Index) Parameters
Trend Check Function
Support and Resistance Detection
Buy and Sell Logic
Buy Signal:
Sell Signal:
Strategy Concept
This strategy aims to identify potential reversal points in a price trend by combining momentum indicators (RSI and MFI), volume-weighted price (VWAP), and recent price action trends. It looks for conditions where the price is poised to change direction, either bouncing off a support level in a potential uptrend or falling from a resistance level in a potential downtrend.
By incorporating both price level analysis (support/resistance) and momentum indicators, the strategy seeks to increase the likelihood of identifying significant trend reversals, taking into consideration both recent price movements and the current price's position relative to historical highs and lows.
VWAP (Volume-Weighted Average Price)
- VWAP acts as a benchmark to determine the general market trend. It's an average price weighted by volume.
- A price above VWAP is often considered bullish, and a price below VWAP is seen as bearish.
MFI (Money Flow Index) and RSI (Relative Strength Index) Parameters
- MFI is a volume-weighted RSI, used to identify overbought (above 70) or oversold (below 30) conditions.
- RSI is a momentum indicator that measures the magnitude of recent price changes to identify overbought or oversold conditions, similar to MFI.
- The script uses standard overbought (70) and oversold (30) thresholds for both MFI and RSI.
Trend Check Function
- The function trendCheck analyzes the past pastBars candles to count how many were bullish (closing price higher than the opening price) and bearish.
- This function is used to assess the recent trend direction.
Support and Resistance Detection
- The script calculates the highest high (highestHigh) and lowest low (lowestLow) over the last lookbackSR (50) periods to identify potential support and resistance levels.
- isNearSupport and isNearResistance are conditions to check if the current price is within 0.08% of these identified levels, indicating proximity to support or resistance.
Buy and Sell Logic
Buy Signal:
- The RSI crosses over the oversold threshold (30).
- The MFI is also below its oversold level (30).
- The current price is above the VWAP.
- The recent trend (past 20 bars) has been predominantly bearish.
- The price is near the identified support level.
Sell Signal:
- The RSI crosses under the overbought threshold (70).
- The MFI is above its overbought level (70).
- The current price is below the VWAP.
- The recent trend has been predominantly bullish.
- The price is near the identified resistance level.
開源腳本
秉持TradingView一貫精神,這個腳本的創作者將其設為開源,以便交易者檢視並驗證其功能。向作者致敬!您可以免費使用此腳本,但請注意,重新發佈代碼需遵守我們的社群規範。
免責聲明
這些資訊和出版物並非旨在提供,也不構成TradingView提供或認可的任何形式的財務、投資、交易或其他類型的建議或推薦。請閱讀使用條款以了解更多資訊。
開源腳本
秉持TradingView一貫精神,這個腳本的創作者將其設為開源,以便交易者檢視並驗證其功能。向作者致敬!您可以免費使用此腳本,但請注意,重新發佈代碼需遵守我們的社群規範。
免責聲明
這些資訊和出版物並非旨在提供,也不構成TradingView提供或認可的任何形式的財務、投資、交易或其他類型的建議或推薦。請閱讀使用條款以了解更多資訊。