OPEN-SOURCE SCRIPT
已更新 ASG Delta %
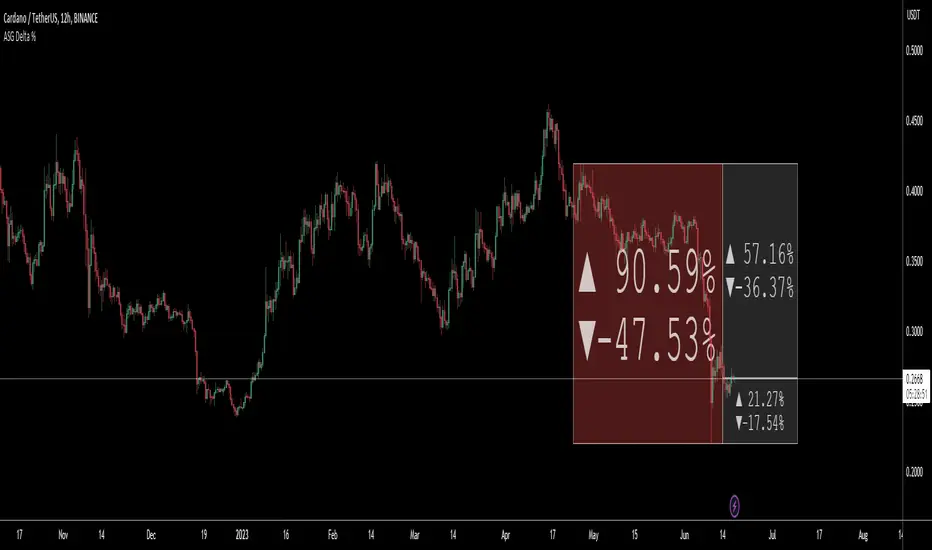
This utility script provides a convenient way to calculate the percentage gain or drop of a token's price within a user-defined date range. It eliminates the need for manual measurement on individual charts, saving time and effort.
The script is particularly valuable when integrated into a daily token scanning routine for watchlists. By comparing the significant gains or drops among different tokens, traders can identify potential trading opportunities.
Simply select the desired date range, and the script will identify the highest and lowest price points achieved during that period. It then shows a visual representation in the form of a bullish or bearish box, displaying the percentage change (delta %). If the current price falls within the box's upper and lower bounds, additional percentage information can be shown in either the 'normal' or 'reverse' mode.
For instance, if a token experiences a -52.35% drop, enabling the 'Reverse' setting will reveal a potential 109.86% gain (from the low), or a 76.02% gain (from current price) or a potential drop of -16.5% (from current price) etc.. Having these basic statistics available, without having to manually chart them, especially during prolonged bear or bull markets, enables traders to make informed decisions and position themselves for more profitable trades.
I hope you find this script valuable. Your comments and recommendations are welcome as they will help improve the script's functionality further.
發行說明
1. Made some modifications to display both 'normal' and 'reverse' percentage changes at the same time2. Added some 'style' changes like "[BOX]" to display the extra deltas within a Box background - this allows the internal text to auto-resize
3. Some minor mods to allow you to display "arrows" or "%" signs if desired
4. Streamlined code
開源腳本
秉持TradingView一貫精神,這個腳本的創作者將其設為開源,以便交易者檢視並驗證其功能。向作者致敬!您可以免費使用此腳本,但請注意,重新發佈代碼需遵守我們的社群規範。
免責聲明
這些資訊和出版物並非旨在提供,也不構成TradingView提供或認可的任何形式的財務、投資、交易或其他類型的建議或推薦。請閱讀使用條款以了解更多資訊。
開源腳本
秉持TradingView一貫精神,這個腳本的創作者將其設為開源,以便交易者檢視並驗證其功能。向作者致敬!您可以免費使用此腳本,但請注意,重新發佈代碼需遵守我們的社群規範。
免責聲明
這些資訊和出版物並非旨在提供,也不構成TradingView提供或認可的任何形式的財務、投資、交易或其他類型的建議或推薦。請閱讀使用條款以了解更多資訊。