OPEN-SOURCE SCRIPT
Stacked MAs and Solid Price Volume
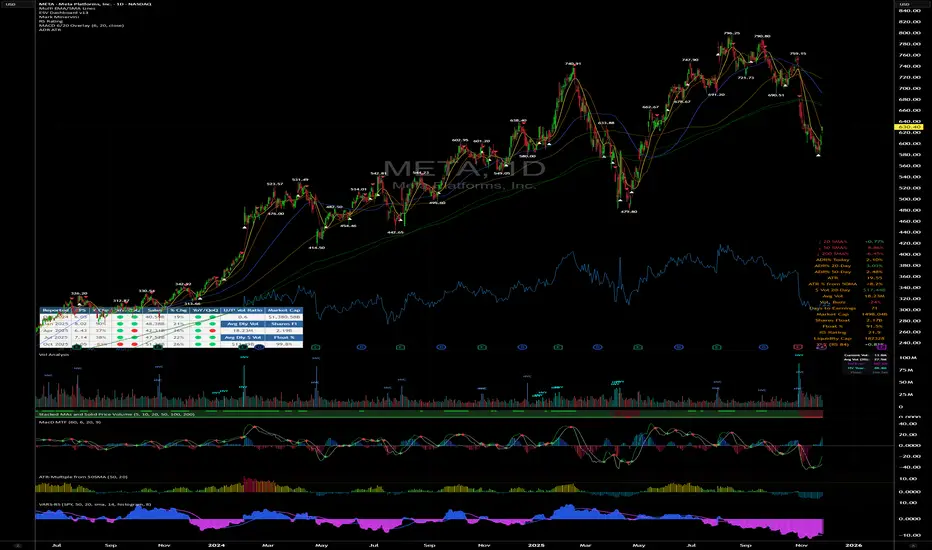
Stacked MAs and Solid Price Volume is a lower-pane trend alignment indicator that provides instant visual confirmation of moving average structure and price positioning. The indicator monitors all six key SMAs (5, 10, 20, 50, 100, and 200-day) and displays background shading based on trend health: light red when price trades below the 200 SMA (caution zone), light green when price is above the 200 SMA (bullish territory), and darker green when price is above the 200 SMA AND all SMAs are perfectly stacked in bullish order (5 > 10 > 20 > 50 > 100 > 200)—the ideal trending condition. A thick green horizontal line appears during periods of full stack alignment, making it easy to scan charts and identify sustained uptrends. Green dots at the bottom mark price crossovers above the 50 SMA (potential trend resumption signals), while white dots at the top flag 5/10 SMA bullish crossovers (short-term momentum shifts). The colored strip along the bottom displays the 200 SMA's trend direction: blue for rising, red for falling, and gray for flat—giving you immediate context on the long-term trend's trajectory. Smart IPO handling ensures the indicator works properly on newer stocks with limited price history by defaulting unavailable longer-term comparisons to neutral. Perfect for trend followers who want a quick, clean read on moving average alignment without cluttering their price chart.
開源腳本
秉持TradingView一貫精神,這個腳本的創作者將其設為開源,以便交易者檢視並驗證其功能。向作者致敬!您可以免費使用此腳本,但請注意,重新發佈代碼需遵守我們的社群規範。
免責聲明
這些資訊和出版物並非旨在提供,也不構成TradingView提供或認可的任何形式的財務、投資、交易或其他類型的建議或推薦。請閱讀使用條款以了解更多資訊。
免責聲明
這些資訊和出版物並非旨在提供,也不構成TradingView提供或認可的任何形式的財務、投資、交易或其他類型的建議或推薦。請閱讀使用條款以了解更多資訊。