OPEN-SOURCE SCRIPT
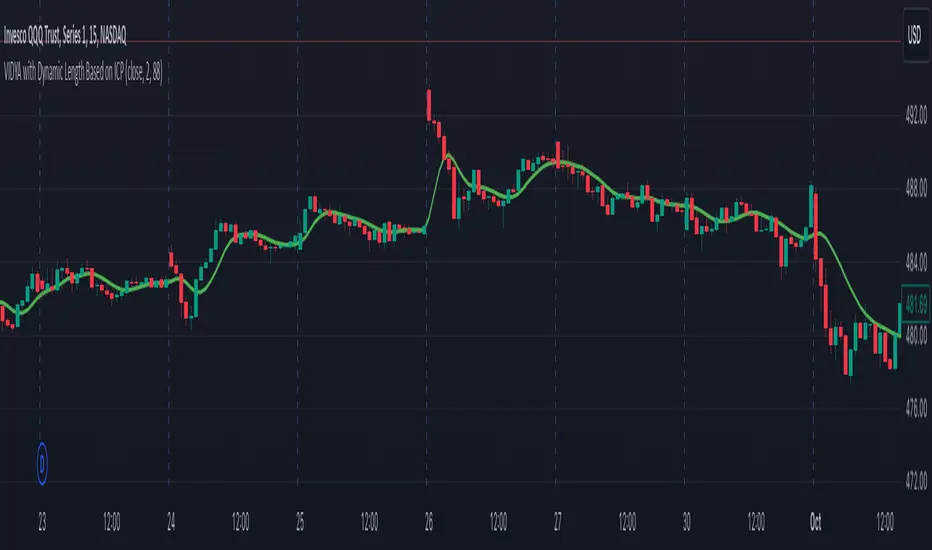
VIDYA with Dynamic Length Based on ICP

This script is a Pine Script-based indicator that combines two key concepts: the Instantaneous Cycle Period (ICP) from Dr. John Ehlers and the Variable Index Dynamic Average (VIDYA). Here's an overview of how the script works:
Components:
Instantaneous Cycle Period (ICP):
This part of the indicator uses Dr. John Ehlers' approach to detect the market cycle length dynamically. It calculates the phase of price movement by computing the in-phase and quadrature components of the price detrended over a specific period.
The ICP helps adjust the smoothing length dynamically, giving a real-time estimate of the dominant cycle in price action. The script uses a phase calculation, adjusts it for cycle dynamics, and smoothes it for more reliable readings.
VIDYA (Variable Index Dynamic Average):
VIDYA is a moving average that dynamically adjusts its smoothing length based on the market conditions, in this case, using the RSI (Relative Strength Index) as a weight.
The length of VIDYA is determined by the dynamically calculated ICP, allowing it to adapt to changing market cycles.
This indicator performs several recursive layers of VIDYA smoothing (applying VIDYA multiple times) to provide a more refined result.
Key Features:
Dynamic Length: The length for the VIDYA calculation is derived from the smoothed ICP value, meaning that the smoothing adapts to the detected cycle length in real-time, making the indicator more responsive to market conditions.
Multiple VIDYA Layers: The script applies multiple layers of VIDYA smoothing (up to 5 iterations), further refining the output to smooth out market noise while maintaining responsiveness.
Plotting: The final smoothed VIDYA value and the smoothed ICP length are plotted. Additionally, overbought (70) and oversold (30) horizontal lines are provided for visual reference.
Application:
This indicator helps identify trends, smooths out price data, and adapts dynamically to market cycles. It's useful for detecting shifts in momentum and trends, and traders can use it to identify overbought or oversold conditions based on dynamically calculated thresholds.
開源腳本
秉持TradingView一貫精神,這個腳本的創作者將其設為開源,以便交易者檢視並驗證其功能。向作者致敬!您可以免費使用此腳本,但請注意,重新發佈代碼需遵守我們的社群規範。
免責聲明
這些資訊和出版物並非旨在提供,也不構成TradingView提供或認可的任何形式的財務、投資、交易或其他類型的建議或推薦。請閱讀使用條款以了解更多資訊。
開源腳本
秉持TradingView一貫精神,這個腳本的創作者將其設為開源,以便交易者檢視並驗證其功能。向作者致敬!您可以免費使用此腳本,但請注意,重新發佈代碼需遵守我們的社群規範。
免責聲明
這些資訊和出版物並非旨在提供,也不構成TradingView提供或認可的任何形式的財務、投資、交易或其他類型的建議或推薦。請閱讀使用條款以了解更多資訊。