OPEN-SOURCE SCRIPT
25-75 Percentile SuperTrend | Mattes
25-75 Percentile SuperTrend | Mattes
Overview
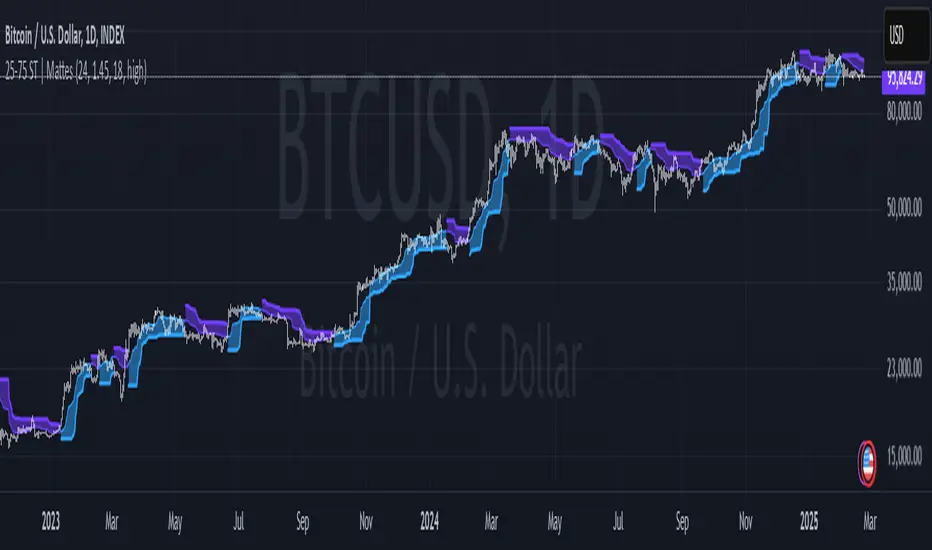
The 25-75 Percentile SuperTrend is an advanced trend-following indicator that enhances the traditional SuperTrend concept by incorporating percentile-based smoothing. Instead of using a simple moving average or median price, this indicator calculates the 25th and 75th percentiles over a user-defined period. These percentiles act as dynamic trend levels, adjusting more responsively to price volatility while reducing noise.
How It’s Calculated
Percentile Smoothing:
SuperTrend Logic:
Signal Generation:
Uses Percentiles Instead of a Moving Average:
Traditional SuperTrend relies on ATR-based offsets from a moving average.
This version replaces the moving average with percentile smoothing, which adapts better to price behavior.
Better Noise Filtering:
Since percentiles are less sensitive to outliers, this indicator reduces false signals in choppy markets.
More Adaptive to Market Conditions:
Application Examples
Risks & Disclaimers
Not a Standalone Strategy: This indicator should be used with other confirmation tools like volume analysis, momentum oscillators, or support/resistance levels.
False Signals in Sideways Markets: Although it reduces noise, choppy markets can still generate occasional false trend flips.
Market Adaptation Required: The best parameters may vary depending on the asset and timeframe.
This indicator was heavily inspired and influenced by the IRS/viResearch Median SuperTrend, improving upon its concept by transforming its median based calculation into a more responsive & effective counterpart of its former self.
Shoutout to all my Masterclass Brothers and L4 Gs!
Overview
The 25-75 Percentile SuperTrend is an advanced trend-following indicator that enhances the traditional SuperTrend concept by incorporating percentile-based smoothing. Instead of using a simple moving average or median price, this indicator calculates the 25th and 75th percentiles over a user-defined period. These percentiles act as dynamic trend levels, adjusting more responsively to price volatility while reducing noise.
How It’s Calculated
Percentile Smoothing:
- The 25th percentile of the selected source (low-end smoothing).
- The 75th percentile of the selected source (high-end smoothing).
SuperTrend Logic:
- The upper band is set at the 75th percentile + ATR multiplier.
- The lower band is set at the 25th percentile - ATR multiplier.
- The trend flips when the price crosses above/below these dynamic bands.
Signal Generation:
- A bullish trend occurs when price remains above the lower band.
- A bearish trend occurs when price remains below the upper band.
- Trend shifts are highlighted with colored bars and lines for easy visualization.
- How It Differs From Traditional SuperTrend
Uses Percentiles Instead of a Moving Average:
Traditional SuperTrend relies on ATR-based offsets from a moving average.
This version replaces the moving average with percentile smoothing, which adapts better to price behavior.
Better Noise Filtering:
Since percentiles are less sensitive to outliers, this indicator reduces false signals in choppy markets.
More Adaptive to Market Conditions:
- The percentile smoothing dynamically adjusts trend detection based on price distribution rather than fixed calculations.
- Why It’s Useful
- ✅ Reduces Whipsaws: Helps minimize false breakouts by using percentile-based bands instead of traditional ATR-only bands.
- ✅ Works in Different Market Conditions: Effective in both trending and ranging environments due to its adaptive nature.
- ✅ Enhances Trend Confidence: Provides clearer signals by filtering noise more effectively than standard SuperTrend indicators.
Application Examples
- Trend Following: Use it to identify strong upward or downward trends.
- Stop-Loss Placement: The upper and lower bands can serve as dynamic stop-loss levels.
- Breakout Confirmation: Trend flips can confirm breakout signals from other indicators.
- Mean Reversion Strategy Filtering: The 25-75 range helps identify strong versus weak reversals.
Risks & Disclaimers
Not a Standalone Strategy: This indicator should be used with other confirmation tools like volume analysis, momentum oscillators, or support/resistance levels.
False Signals in Sideways Markets: Although it reduces noise, choppy markets can still generate occasional false trend flips.
Market Adaptation Required: The best parameters may vary depending on the asset and timeframe.
This indicator was heavily inspired and influenced by the IRS/viResearch Median SuperTrend, improving upon its concept by transforming its median based calculation into a more responsive & effective counterpart of its former self.
Shoutout to all my Masterclass Brothers and L4 Gs!
開源腳本
本著TradingView的真正精神,此腳本的創建者將其開源,以便交易者可以查看和驗證其功能。向作者致敬!雖然您可以免費使用它,但請記住,重新發佈程式碼必須遵守我們的網站規則。
免責聲明
這些資訊和出版物並不意味著也不構成TradingView提供或認可的金融、投資、交易或其他類型的意見或建議。請在使用條款閱讀更多資訊。
開源腳本
本著TradingView的真正精神,此腳本的創建者將其開源,以便交易者可以查看和驗證其功能。向作者致敬!雖然您可以免費使用它,但請記住,重新發佈程式碼必須遵守我們的網站規則。
免責聲明
這些資訊和出版物並不意味著也不構成TradingView提供或認可的金融、投資、交易或其他類型的意見或建議。請在使用條款閱讀更多資訊。