OPEN-SOURCE SCRIPT
已更新 Volume Data Customized Timeframe
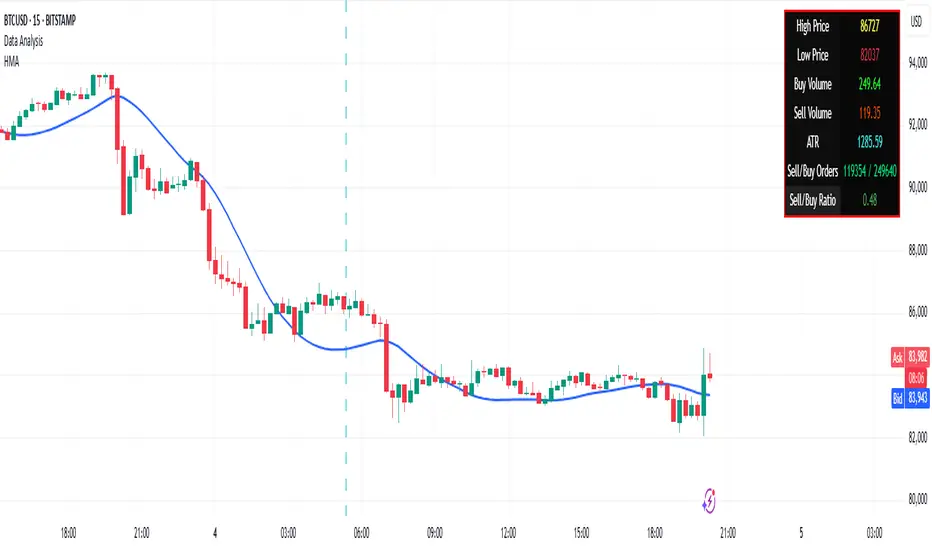
The "Volume Data Customized Timeframe" (VolData CTF) indicator provides traders with an enhanced volume analysis tool that aggregates buy and sell volume over a user-defined timeframe. It enables a comparative assessment of bullish and bearish volume trends, offering deeper insights into market sentiment. The indicator features a customizable display table with user-selectable themes and positioning, providing essential volume metrics for improved trading decisions.
1. Introduction:
The "Volume Data Customized Timeframe" indicator is designed to help traders analyze volume trends across different timeframes. It allows users to customize the period for volume calculations, view the ratio of selling to buying volume, and present the data in a user-friendly table format.
2. Features:
Selectable timeframe for volume analysis (default: chart timeframe)
Calculation of bullish (buy) and bearish (sell) volume
Customizable table size, theme, and positioning
Displays key volume metrics:
Total Buy Volume
Total Sell Volume
Sell/Buy Volume Ratio
Analysis period in minutes, days, weeks, or months
3. Indicator Inputs:
Average Volume Lookback (n): Number of bars used to calculate volume statistics.
Select Timeframe: Custom timeframe for volume calculations (leave empty to use the chart's timeframe).
Table Size: Choose from Small, Medium, or Big to adjust text size.
Table Theme: Choose between Light and Dark themes.
Table Position: Place the table in any corner of the chart (top-left, top-right, bottom-left, bottom-right).
4. How It Works:
The indicator retrieves volume data for the selected timeframe.
It aggregates bullish and bearish volume based on the lookback period.
The sell-to-buy volume ratio is calculated and color-coded (green for bullish dominance, red for bearish dominance).
The volume statistics are displayed in a customizable table for easy reference.
5. Interpretation:
Δ BUY VOL: Represents the total volume of bullish (up-closing) bars within the lookback period.
Δ SELL VOL: Represents the total volume of bearish (down-closing) bars within the lookback period.
Δ SELL/Δ BUY: The ratio of bearish to bullish volume; values above 1 indicate more selling pressure, while values below 1 indicate buying dominance.
Period (M/D/W/M): Displays the selected timeframe for volume aggregation.
發行說明
✅ Accounts for partial buying and selling in each candle✅ Doesn’t assume entire volume belongs to buyers/sellers
✅ More accurate approximation of buy/sell volume
發行說明
✅ Accounts for partial buying and selling in each candle✅ Doesn’t assume entire volume belongs to buyers/sellers
✅ More accurate approximation of buy/sell volume
發行說明
The script will always use standard OHLC candles, no matter what chart type you're using! 🚀Modifications made if division by '0'
發行說明
small fix發行說明
Added Orders detailfine tuned ATR
sell/buy Ratio
開源腳本
秉持TradingView一貫精神,這個腳本的創作者將其設為開源,以便交易者檢視並驗證其功能。向作者致敬!您可以免費使用此腳本,但請注意,重新發佈代碼需遵守我們的社群規範。
免責聲明
這些資訊和出版物並非旨在提供,也不構成TradingView提供或認可的任何形式的財務、投資、交易或其他類型的建議或推薦。請閱讀使用條款以了解更多資訊。
免責聲明
這些資訊和出版物並非旨在提供,也不構成TradingView提供或認可的任何形式的財務、投資、交易或其他類型的建議或推薦。請閱讀使用條款以了解更多資訊。