OPEN-SOURCE SCRIPT
Magnet Zones: Trap Detection & Flow Map [@darshakssc]
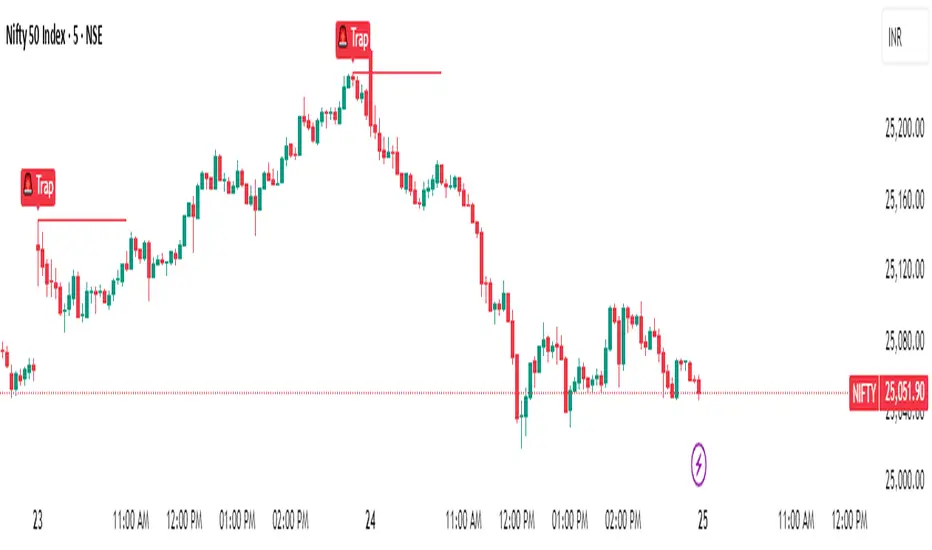
This script detects potential bull and bear trap candles—price actions that may appear strong but are likely to reverse—based on:
🔺 Wick structure
📊 Volume spike behavior
💡 RSI confirmation logic
⏳ Signal cooldown filter to reduce false positives
The indicator then plots:
🟥 Red “🚨 Trap” labels above candles showing possible bull traps
🟩 Green “🧲 Trap” labels below candles showing possible bear traps
➖ Horizontal zone lines to mark these trap levels as “magnet zones,” which may act as future support or resistance
🧠 How It Works:
1. Volume Spike Detection
2. The script first checks for unusually high volume (1.5× the average volume over the last 20 candles).
3. Trap Candle Structure
4. A trap is suspected when there is a long wick opposite the direction of the candle body, signaling a failed breakout or price manipulation.
5. RSI Confirmation
6. Bull Traps: RSI must be above 60
7. Bear Traps: RSI must be below 40
✅ This helps validate whether the price was overbought or oversold.
✅ Cooldown Mechanism
✅ After a trap is detected, it waits for 10 bars before allowing another signal—this reduces noise and overfitting.
✅ How to Use It:
1. Apply on any timeframe, especially effective for intraday trading (e.g. 5m, 15m, 1h).
2. Use the trap signals as early warnings to avoid fake breakouts.
3. Combine with your own strategy or trend-following system for confirmation.
4. The trap lines (magnet zones) can be used as dynamic support/resistance levels for future pullbacks or reversals.
⚠️ Important Note:
This script is for educational purposes only and is not financial advice.
Always use traps in combination with your personal discretion, risk management, and other confluence tools.
開源腳本
秉持TradingView一貫精神,這個腳本的創作者將其設為開源,以便交易者檢視並驗證其功能。向作者致敬!您可以免費使用此腳本,但請注意,重新發佈代碼需遵守我們的社群規範。
免責聲明
這些資訊和出版物並非旨在提供,也不構成TradingView提供或認可的任何形式的財務、投資、交易或其他類型的建議或推薦。請閱讀使用條款以了解更多資訊。
開源腳本
秉持TradingView一貫精神,這個腳本的創作者將其設為開源,以便交易者檢視並驗證其功能。向作者致敬!您可以免費使用此腳本,但請注意,重新發佈代碼需遵守我們的社群規範。
免責聲明
這些資訊和出版物並非旨在提供,也不構成TradingView提供或認可的任何形式的財務、投資、交易或其他類型的建議或推薦。請閱讀使用條款以了解更多資訊。