OPEN-SOURCE SCRIPT
Approx. Footprint: Volume Delta
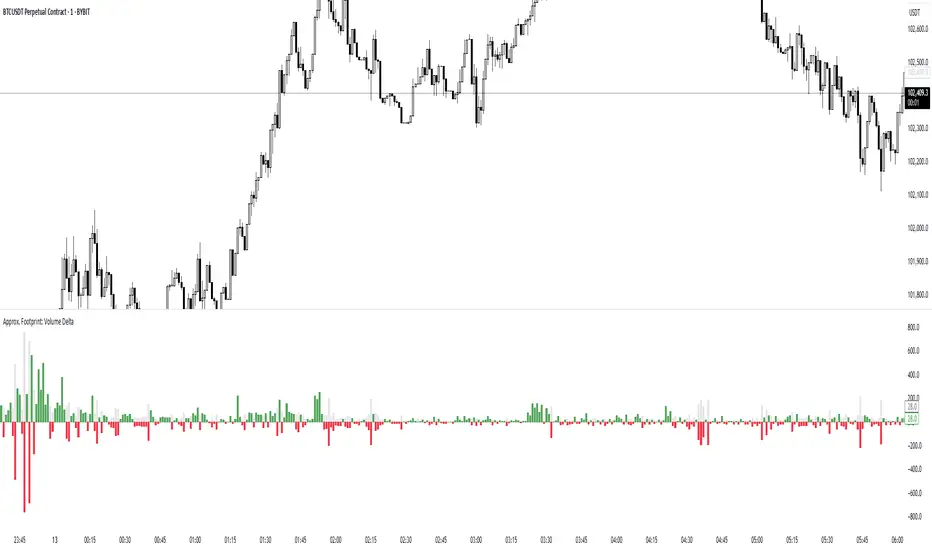
This indicator brings you a simplified “footprint” view by charting the volume delta—the imbalance between bullish and bearish volume—alongside total bar volume.
Delta Bars: Green/red columns show where buyers (close > open) or sellers (close < open) dominated each bar.
Total Volume: Semi-transparent gray columns in the background give you overall context.
No Hidden Data: Works on any symbol/timeframe without tick-by-tick or bid/ask feeds.
Use it to quickly spot bars with strong buying or selling pressure, identify momentum shifts, and confirm breakouts or reversals—all within TradingView’s standard volume streams.
開源腳本
秉持TradingView一貫精神,這個腳本的創作者將其設為開源,以便交易者檢視並驗證其功能。向作者致敬!您可以免費使用此腳本,但請注意,重新發佈代碼需遵守我們的社群規範。
免責聲明
這些資訊和出版物並非旨在提供,也不構成TradingView提供或認可的任何形式的財務、投資、交易或其他類型的建議或推薦。請閱讀使用條款以了解更多資訊。
免責聲明
這些資訊和出版物並非旨在提供,也不構成TradingView提供或認可的任何形式的財務、投資、交易或其他類型的建議或推薦。請閱讀使用條款以了解更多資訊。