OPEN-SOURCE SCRIPT
Daily & Multi-Day High/Low
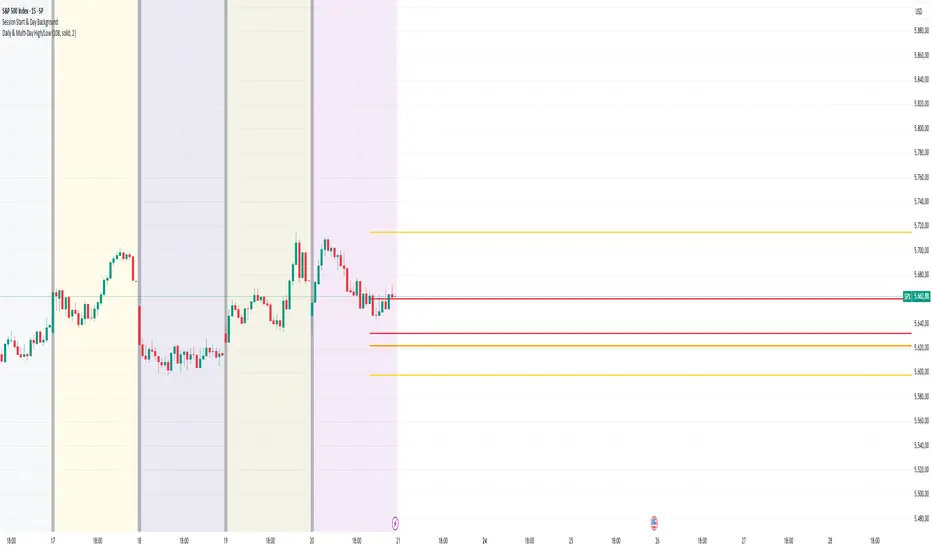
Daily & Multi-Candle High/Low Indicator
This indicator clearly highlights essential price levels directly on your chart, significantly improving your trading decisions:
Customization Options:
Ideal for day traders, swing traders, and price-action traders looking for clear and actionable daily levels on their charts.
This indicator clearly highlights essential price levels directly on your chart, significantly improving your trading decisions:
- First Candle High/Low (Session Open):
Quickly identify the high and low of the first candle each trading day, ideal for session-open traders. - Previous Day's High/Low:
Automatically plots the highest and lowest prices from the previous trading day, crucial for daily breakout or reversal strategies. - Multi-Candle High/Low (Customizable Period):
Easily track the highest and lowest points of the last X candles (default: 108 candles). Perfect for spotting key support and resistance zones.
Customization Options:
- Adjust colors, line styles (solid, dashed, dotted), and line thickness directly from the settings for personalized visibility.
Ideal for day traders, swing traders, and price-action traders looking for clear and actionable daily levels on their charts.
開源腳本
秉持TradingView一貫精神,這個腳本的創作者將其設為開源,以便交易者檢視並驗證其功能。向作者致敬!您可以免費使用此腳本,但請注意,重新發佈代碼需遵守我們的社群規範。
免責聲明
這些資訊和出版物並非旨在提供,也不構成TradingView提供或認可的任何形式的財務、投資、交易或其他類型的建議或推薦。請閱讀使用條款以了解更多資訊。
開源腳本
秉持TradingView一貫精神,這個腳本的創作者將其設為開源,以便交易者檢視並驗證其功能。向作者致敬!您可以免費使用此腳本,但請注意,重新發佈代碼需遵守我們的社群規範。
免責聲明
這些資訊和出版物並非旨在提供,也不構成TradingView提供或認可的任何形式的財務、投資、交易或其他類型的建議或推薦。請閱讀使用條款以了解更多資訊。