PROTECTED SOURCE SCRIPT
Level Breakout [Jinesh0987]
📘 Level Marking System by Jinesh
🧭 Overview
This all-in-one price-action framework combines:
🔹 Swing structure
🔹 Key day & Fibonacci levels
🔹 Breakout entries
🔹 Retest reversal setups
Each part builds on the previous one, helping traders visually track structure shifts, level reactions, and high-probability trade setups — all with built-in risk/reward visualization.
🟩 Part 1 — Swing Structure
Detects swing highs & lows dynamically (no pivot lookahead).
Works using ATR- or %-based thresholds to confirm swing reversals.
Draws labeled Swing High / Swing Low dashed lines.
Optional Break of Structure (BOS) or candlestick-pattern confirmations.
Optional bar-coloring by trend (teal = up, red = down).
✅ Gives a clean map of recent price structure and potential turning points.
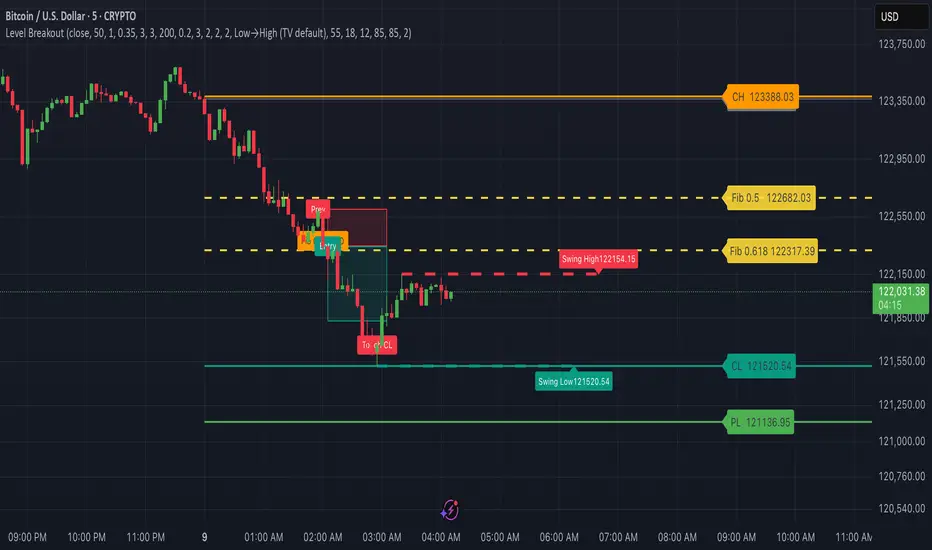
🟧 Part 2 — Day Levels + Fibonacci
Plots Previous Day High (PH), Low (PL), Close (PC)
and Current Day High (CH), Low (CL) automatically.
Adds Fibonacci 0.5 and 0.618 retracement lines from the previous day’s range.
Fully customizable — colors, line widths, dashed/solid styles, right-side labels.
These levels act as the foundation for breakout and retest setups.
✅ Gives your chart institutional reference points for intraday reactions.
🚀 Part 3 — Breakout Entries & 2R Targets
Detects when a candle closes above or below any key level (from Part 2).
Marks:
🔴 Previous candle → Stop-loss candle
🟧 Breakout candle → Signal candle
🟩 Next candle → Entry candle
Entry = next-bar open
Stop-loss = previous-bar low (long) / high (short)
Target = 2 × risk
Draws compact red & green boxes to visualize SL and TP zones.
✅ Perfect for clean, momentum-based breakout plays with defined R:R.
🔄 Part 4 — Touch + Retest Reversal Entry at Level
Waits for price to touch a major level (PH, PL, PC, CH, CL, Fib 0.5 or 0.618).
On the next candle, if price retests that same level and reverses,
→ it confirms a reversal entry setup.
Marks:
🔴 Touch candle → Stop-loss reference
🟧 Reversal candle → Signal
🟩 Entry at close of reversal candle
Stop-loss = touch-bar low (long) / high (short)
Target = 2 × risk (auto-drawn green box).
Includes optional wick/body touch filter and tick-tolerance for precision.
✅ Ideal for reversal trades on retests — captures quick bounces from day or fib levels.
🎯 How to Use
Add this indicator on any chart (5 min – 1 h works best).
Use Parts 1 & 2 for structure + levels.
Watch for 🟧 + 🟩 label patterns at key levels to confirm breakout or reversal entries.
Follow the built-in red/green boxes for your stop & 2R target zones.
⚙️ Customization
✅ Box span (length)
✅ Box transparency
✅ Bar-color style
✅ Wick/body touch logic
✅ 2R visual extension toggle
🧠 Author
Developed by Jinesh — merging traditional price-action structure with modern visualization.
Perfect for traders who like to read charts visually and manage risk precisely.
📈 For educational use only. Not financial advice.
🧭 Overview
This all-in-one price-action framework combines:
🔹 Swing structure
🔹 Key day & Fibonacci levels
🔹 Breakout entries
🔹 Retest reversal setups
Each part builds on the previous one, helping traders visually track structure shifts, level reactions, and high-probability trade setups — all with built-in risk/reward visualization.
🟩 Part 1 — Swing Structure
Detects swing highs & lows dynamically (no pivot lookahead).
Works using ATR- or %-based thresholds to confirm swing reversals.
Draws labeled Swing High / Swing Low dashed lines.
Optional Break of Structure (BOS) or candlestick-pattern confirmations.
Optional bar-coloring by trend (teal = up, red = down).
✅ Gives a clean map of recent price structure and potential turning points.
🟧 Part 2 — Day Levels + Fibonacci
Plots Previous Day High (PH), Low (PL), Close (PC)
and Current Day High (CH), Low (CL) automatically.
Adds Fibonacci 0.5 and 0.618 retracement lines from the previous day’s range.
Fully customizable — colors, line widths, dashed/solid styles, right-side labels.
These levels act as the foundation for breakout and retest setups.
✅ Gives your chart institutional reference points for intraday reactions.
🚀 Part 3 — Breakout Entries & 2R Targets
Detects when a candle closes above or below any key level (from Part 2).
Marks:
🔴 Previous candle → Stop-loss candle
🟧 Breakout candle → Signal candle
🟩 Next candle → Entry candle
Entry = next-bar open
Stop-loss = previous-bar low (long) / high (short)
Target = 2 × risk
Draws compact red & green boxes to visualize SL and TP zones.
✅ Perfect for clean, momentum-based breakout plays with defined R:R.
🔄 Part 4 — Touch + Retest Reversal Entry at Level
Waits for price to touch a major level (PH, PL, PC, CH, CL, Fib 0.5 or 0.618).
On the next candle, if price retests that same level and reverses,
→ it confirms a reversal entry setup.
Marks:
🔴 Touch candle → Stop-loss reference
🟧 Reversal candle → Signal
🟩 Entry at close of reversal candle
Stop-loss = touch-bar low (long) / high (short)
Target = 2 × risk (auto-drawn green box).
Includes optional wick/body touch filter and tick-tolerance for precision.
✅ Ideal for reversal trades on retests — captures quick bounces from day or fib levels.
🎯 How to Use
Add this indicator on any chart (5 min – 1 h works best).
Use Parts 1 & 2 for structure + levels.
Watch for 🟧 + 🟩 label patterns at key levels to confirm breakout or reversal entries.
Follow the built-in red/green boxes for your stop & 2R target zones.
⚙️ Customization
✅ Box span (length)
✅ Box transparency
✅ Bar-color style
✅ Wick/body touch logic
✅ 2R visual extension toggle
🧠 Author
Developed by Jinesh — merging traditional price-action structure with modern visualization.
Perfect for traders who like to read charts visually and manage risk precisely.
📈 For educational use only. Not financial advice.
受保護腳本
此腳本以閉源形式發佈。 不過,您可以自由且不受任何限制地使用它 — 在此處了解更多資訊。
免責聲明
這些資訊和出版物並不意味著也不構成TradingView提供或認可的金融、投資、交易或其他類型的意見或建議。請在使用條款閱讀更多資訊。
受保護腳本
此腳本以閉源形式發佈。 不過,您可以自由且不受任何限制地使用它 — 在此處了解更多資訊。
免責聲明
這些資訊和出版物並不意味著也不構成TradingView提供或認可的金融、投資、交易或其他類型的意見或建議。請在使用條款閱讀更多資訊。