OPEN-SOURCE SCRIPT
EMA TREND
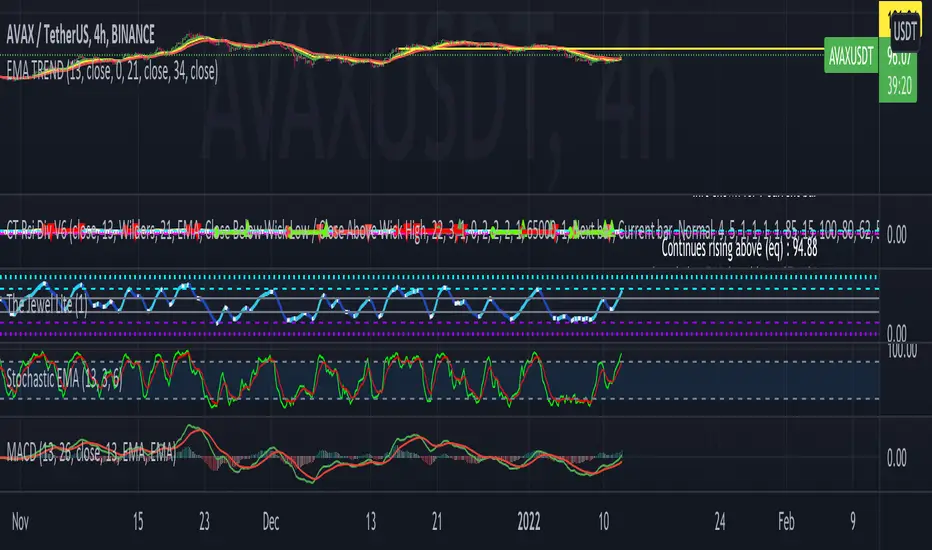
This EMA Trend indicator uses the 13 EMA, 21 EMA, and 34 EMA in the following color codes of Green for 13 EMA, Yellow for 21 EMA, and Red for 34 EMA lines to demonstrate overall trend when applied to the chart. Instead of just one EMA line, using three EMA lines to determine the trend. Use this indicator to in the following method. If the green angled up along with yellow and red, there is strong upward trend. If the green crosses below the yellow, trend is waning. If the red is on top of the yellow and green with downward slope, there is a strong downward trend.
開源腳本
秉持TradingView一貫精神,這個腳本的創作者將其設為開源,以便交易者檢視並驗證其功能。向作者致敬!您可以免費使用此腳本,但請注意,重新發佈代碼需遵守我們的社群規範。
免責聲明
這些資訊和出版物並非旨在提供,也不構成TradingView提供或認可的任何形式的財務、投資、交易或其他類型的建議或推薦。請閱讀使用條款以了解更多資訊。
開源腳本
秉持TradingView一貫精神,這個腳本的創作者將其設為開源,以便交易者檢視並驗證其功能。向作者致敬!您可以免費使用此腳本,但請注意,重新發佈代碼需遵守我們的社群規範。
免責聲明
這些資訊和出版物並非旨在提供,也不構成TradingView提供或認可的任何形式的財務、投資、交易或其他類型的建議或推薦。請閱讀使用條款以了解更多資訊。