PROTECTED SOURCE SCRIPT
[Coingrats] Trading strategie v1 [BETA]
//=================================================================================================
THIS IS A BETA VERSION AND FREE TO USE FOR EVERYONE.
BECOME BETA TESTER, PLACE A COMMENT. FEEDBACK IS VALUED.
WHEN THE BETA PERIOD IS EXPIRED THIS SCRIPT WILL BE ADAPTED TO A FREE VERSION
FOR THE BETA TESTERS (DON'T FORGET YOUR COMMENT) THERE IS A LIFETIME OFFER FOR THE PREMIUM
I DEVELOPED THIS STRATEGY TO QUICKLY DISCOVER TREND CHANGES OR WHERE INDECISION IS PRESENT
DO NOT TRADE BLINDLY, BUT CHECK THE FINDINGS THAT YOU SEE ON THE CHART
USE WITH HOLLOW CANDLES ONLY!!!!
ALL PROCESSED IN ONE INDICATOR, ALSO WITH A FREE TRADINGVIEW ACCOUNT YOU CAN USE HIM.
FOR CONFIRMTION YOU CAN ADD THE INDICATORS RSI AND MACD
WE ARE ALSO DEVELOPING OUR OWN CRYPTORADAR THAT CAN GIVE YOU VARIOUS SIGNALS ON TELEGRAM.
CHECK THE WEBSITE MYCRYPTORADAR.COM
//=================================================================================================
//INFO DIVERGENCE STRATEGIE
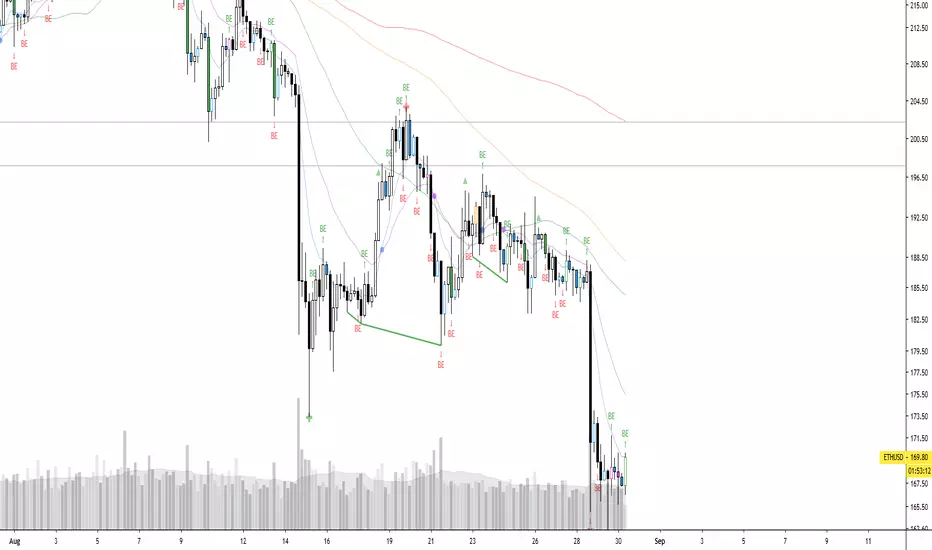
- When there is a line visible the bull(green)/bear(red) divergence is legit. Go long or short
- When there is a green triangle above a candle, take some profits on the bull divergence
- When there is a red triangle below a candle, take some profits on the bear divergence
- You can play with the settings but i think this are the best settings.
- Standard settings work best on higher timeframe (4H or higher)
//INFO PIVOT REVERSAL STRATEGIE
- When there is a green cross under a candle = possible signal to go long
- When there is a red cross above a candle = possible signal to go short
//INFO S/R LINES AND TRENDLINES
- Automatic set S/R levels on the timeframe on your chart
- In the settings you can enable trendlines on your chart
- Calculation mode = strict. You get a clean chart with major S/R lines
- Calculation mode = loose. You get a chart with more S/R lines. It helps to find orderblocks
- Top and bottom fractal source. Choose what you like for setting the S/R lines
//INFO CANDLE STRATEGIE
- Paints outside candles green
- Paints inside candles blue
- Paints highwave candles purple
- Paints morning star patterns red
- Paints evening star patterns grey
- Marked bullish engulfing with a green BE mark
- Marked bearish engulfing with a red BE mark
//INFO EMA - SMA
- You have the choice of 5x EMA and 3X SMA lines
- Including crossover alerts for all crossovers
- Standard only crossover EMA8 - EMA21, Golden cross & Death cross (SMA) signals are enabled
- Signal// EMA8 - EMA21 crossover marked a bleu/purple dot on the crossover
- Signal// Golden cross marked a golden cross on the crossover
- Signal// Death cross marked a red cross on the crossover
- In the settings you can set your own crossover alerts
THIS IS A BETA VERSION AND FREE TO USE FOR EVERYONE.
BECOME BETA TESTER, PLACE A COMMENT. FEEDBACK IS VALUED.
WHEN THE BETA PERIOD IS EXPIRED THIS SCRIPT WILL BE ADAPTED TO A FREE VERSION
FOR THE BETA TESTERS (DON'T FORGET YOUR COMMENT) THERE IS A LIFETIME OFFER FOR THE PREMIUM
I DEVELOPED THIS STRATEGY TO QUICKLY DISCOVER TREND CHANGES OR WHERE INDECISION IS PRESENT
DO NOT TRADE BLINDLY, BUT CHECK THE FINDINGS THAT YOU SEE ON THE CHART
USE WITH HOLLOW CANDLES ONLY!!!!
ALL PROCESSED IN ONE INDICATOR, ALSO WITH A FREE TRADINGVIEW ACCOUNT YOU CAN USE HIM.
FOR CONFIRMTION YOU CAN ADD THE INDICATORS RSI AND MACD
WE ARE ALSO DEVELOPING OUR OWN CRYPTORADAR THAT CAN GIVE YOU VARIOUS SIGNALS ON TELEGRAM.
CHECK THE WEBSITE MYCRYPTORADAR.COM
//=================================================================================================
//INFO DIVERGENCE STRATEGIE
- When there is a line visible the bull(green)/bear(red) divergence is legit. Go long or short
- When there is a green triangle above a candle, take some profits on the bull divergence
- When there is a red triangle below a candle, take some profits on the bear divergence
- You can play with the settings but i think this are the best settings.
- Standard settings work best on higher timeframe (4H or higher)
//INFO PIVOT REVERSAL STRATEGIE
- When there is a green cross under a candle = possible signal to go long
- When there is a red cross above a candle = possible signal to go short
//INFO S/R LINES AND TRENDLINES
- Automatic set S/R levels on the timeframe on your chart
- In the settings you can enable trendlines on your chart
- Calculation mode = strict. You get a clean chart with major S/R lines
- Calculation mode = loose. You get a chart with more S/R lines. It helps to find orderblocks
- Top and bottom fractal source. Choose what you like for setting the S/R lines
//INFO CANDLE STRATEGIE
- Paints outside candles green
- Paints inside candles blue
- Paints highwave candles purple
- Paints morning star patterns red
- Paints evening star patterns grey
- Marked bullish engulfing with a green BE mark
- Marked bearish engulfing with a red BE mark
//INFO EMA - SMA
- You have the choice of 5x EMA and 3X SMA lines
- Including crossover alerts for all crossovers
- Standard only crossover EMA8 - EMA21, Golden cross & Death cross (SMA) signals are enabled
- Signal// EMA8 - EMA21 crossover marked a bleu/purple dot on the crossover
- Signal// Golden cross marked a golden cross on the crossover
- Signal// Death cross marked a red cross on the crossover
- In the settings you can set your own crossover alerts
受保護腳本
此腳本以閉源形式發佈。 不過,您可以自由使用,沒有任何限制 — 點擊此處了解更多。
免責聲明
這些資訊和出版物並非旨在提供,也不構成TradingView提供或認可的任何形式的財務、投資、交易或其他類型的建議或推薦。請閱讀使用條款以了解更多資訊。
受保護腳本
此腳本以閉源形式發佈。 不過,您可以自由使用,沒有任何限制 — 點擊此處了解更多。
免責聲明
這些資訊和出版物並非旨在提供,也不構成TradingView提供或認可的任何形式的財務、投資、交易或其他類型的建議或推薦。請閱讀使用條款以了解更多資訊。