INVITE-ONLY SCRIPT
ATR Exhaustion
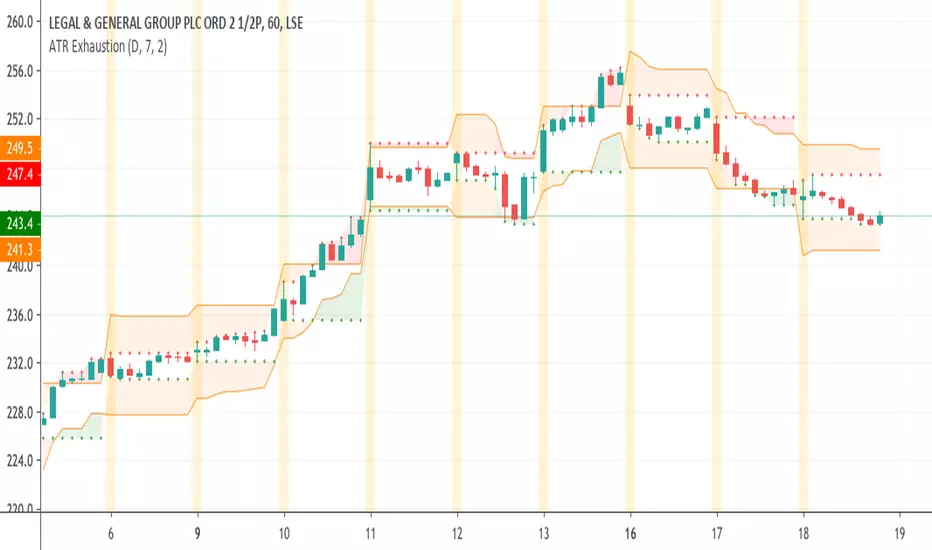
The ATR Exhaustion indicator for Tradingview will overlay the minimum and maximum price limits for a timeframe over your chart. It calculates the price limits be adding and subtracting the ATR level from the high and lows of the period you are interested in.
For example, you can see the daily upper and lower ATR levels whilst on a 15-minute chart. The upper and lower ranges will update as price moves.
Why would this be useful?
It the true price range on average does not move more than x pips/points, then the range boundaries might provide support/resistance levels as price approaches the levels. Additionally, you can use this tool to easily identify how volatile price action has been in comparison to previous periods.
Features
- Easily see ATR Exhaustion areas in any timeframe
- Period highs and lows are plotted and updated as price action unfolds
- Color fills change when price moves beyond the ATR range for easy identification of periods of strong trends or volatility.
僅限邀請腳本
僅限作者授權的用戶訪問此腳本,並且通常需要付費。您可以將其增加到收藏腳本中,但是只有在向作者請求並獲得許可之後,才能使用它。 請聯繫BacktestRookies以了解更多信息,或按照下面作者的說明進行操作。
TradingView 不建議購買並使用此腳本,除非您 100% 信任其作者並了解腳本的工作原理。在許多情況下,您可以在我們的社群腳本中免費找到良好的開源替代方案。
作者的說明
″
想在圖表上使用此腳本?
警告:請閱讀,然後再請求訪問權限。
免責聲明
這些資訊和出版物並不意味著也不構成TradingView提供或認可的金融、投資、交易或其他類型的意見或建議。請在使用條款閱讀更多資訊。