PROTECTED SOURCE SCRIPT
DWP_Fabric_of_Time
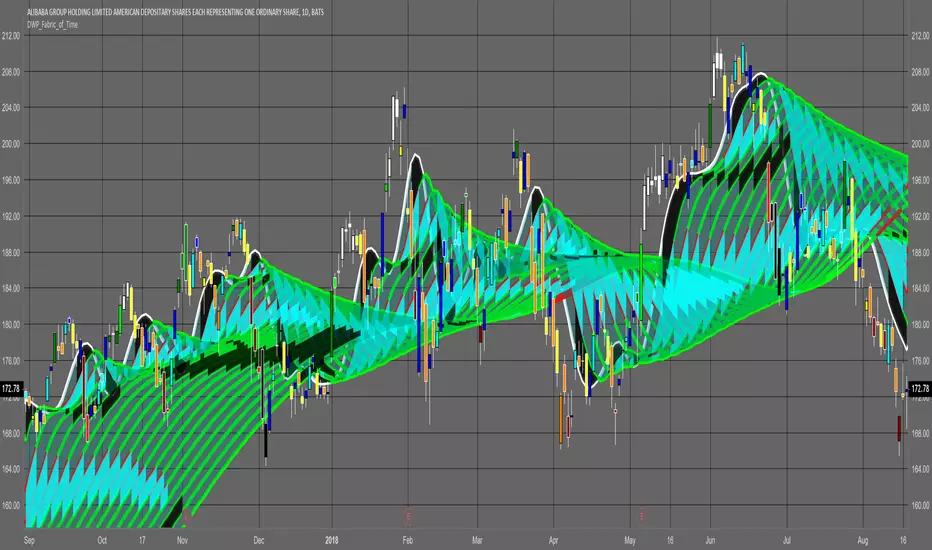
Hello, The following is an indicator I wrote that shows the resistance or support created by the contraction or expansion of moving averages of price over time. The theory is that the areas created by either the decline or acceleration of sma lines are caused by either fear or excitement in the market thus marking the area for future support or resistance to take place. The light blue blocks indicate a decrease in expansion till no expansion. The dark black blocks indicate a decrease in contraction till no contraction. Both blocks can be support or resistance. Once a block is breached look for a reversal. if the block is penetrated over half-way then it will usually continue to the other side before reversing. Their is a multiplier in the script to allow expansion of the indicator. I have also added a bar color indicator for the strength of the move. This can be turned on or off in settings. The colors are paired up as such.
Up = aqua, blue,green, lime,white. | Down = yellow, orange,maroon, red,black.
Hope this helps visualize the market.
Good Trading MoveTrap

Up = aqua, blue,green, lime,white. | Down = yellow, orange,maroon, red,black.
Hope this helps visualize the market.
Good Trading MoveTrap
受保護腳本
此腳本以閉源形式發佈。 不過,您可以自由使用,沒有任何限制 — 點擊此處了解更多。
免責聲明
這些資訊和出版物並非旨在提供,也不構成TradingView提供或認可的任何形式的財務、投資、交易或其他類型的建議或推薦。請閱讀使用條款以了解更多資訊。
免責聲明
這些資訊和出版物並非旨在提供,也不構成TradingView提供或認可的任何形式的財務、投資、交易或其他類型的建議或推薦。請閱讀使用條款以了解更多資訊。