OPEN-SOURCE SCRIPT
DMI Modified
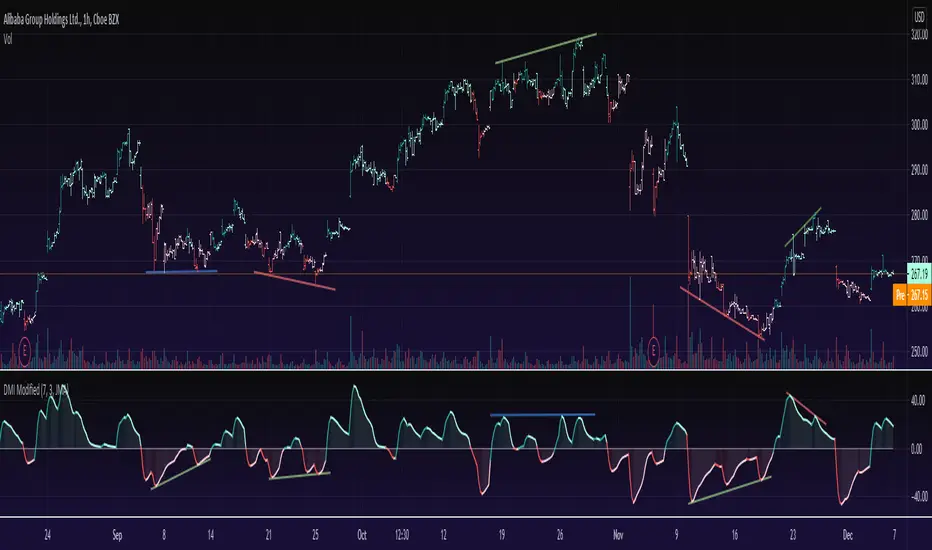
This is a Directional Movement Index (DMI) with a twist, instead of plotting the positive direction of +DI and negative direction for -DI, we subtract the +DI with the -DI on scales of 100 to -100.
The result is plotted with a oscillator to identify the current trend.
DMI Modified supports multiple moving averages (default is JMA with length of 3). You can disable moving averages smoothing in settings.
== About the indicator ==
The Directional Movement Index, or DMI, is an indicator developed by J. Welles Wilder in 1978 that identifies in which direction the price of an asset is moving.
The indicator does this by comparing prior highs and lows and drawing two lines: a positive directional movement line (+DI) and a negative directional movement line (-DI)
In our case we do not draw the two lines, but the result of the subtraction of the two.
== Oscillator Colors ==
GREEN : Asset is above zero line with a strong up trend.
LIGHT GREEN: Asset is above zero line but up trending might be weakening.
RED : Asset is below zero line with a strong downtrend.
LIGHT RED: Asset is below zero line but down trending might be weakening.
== Notes ==
Can also be used to find divergences.
Bar coloring is disabled by default
Like if you like and Enjoy!
There is an idea to make a new strategy combined with DMI Modified (this script) and another script, hench, Follow.
開源腳本
秉持TradingView一貫精神,這個腳本的創作者將其設為開源,以便交易者檢視並驗證其功能。向作者致敬!您可以免費使用此腳本,但請注意,重新發佈代碼需遵守我們的社群規範。
Appreciation of my work: paypal.me/dman103
All Premium indicators: algo.win
LIVE Stream - Pivot Points Algo: youtube.com/channel/UCFyqab-i0xb2jf-c18ufH0A/live
All Premium indicators: algo.win
LIVE Stream - Pivot Points Algo: youtube.com/channel/UCFyqab-i0xb2jf-c18ufH0A/live
免責聲明
這些資訊和出版物並非旨在提供,也不構成TradingView提供或認可的任何形式的財務、投資、交易或其他類型的建議或推薦。請閱讀使用條款以了解更多資訊。