Directional Movement Index (DMI) + AlertsThis is a Study with associated visual indicators and Bullish/Bearish Alerts for Directional Movement (DMI). It consists of an Average Directional Index (ADX), Plus Directional Indicator (+DI) and Minus Directional Indicator (-DI).
Published by J. Welles Wilder in 1978 for use with currencies and commodities which are typically more volatile than stocks and have stronger trends.
Development Notes
---------------------------
This indicator, and most of the descriptions below, were derived largely from the TradingView reference manual. Feedback and suggestions for improvement are more than welcome, as well are recommended Input settings and best practices for use.
tradingview.com/chart/?solution=43000502250
Strategy Description
---------------------------
ADX defines whether or not there is a trend present; +DI and -DI compliment the ADX by taking direction into account. An ADX above 25 indicates a strong trend, and a Bullish alert is subsequently triggered when +DI is above -DI and a Bearish alert when -DI is above +DI.
Note that the Bullish or Bearish crossover alert will only trigger if ADX is simultaneously above 25 during the crossover event. If ADX later rises to 25 and +DI is still greater than -DI, or -DI greater than +DI, then a delayed alert will not trigger by design.
Basic Use
---------------------------
Acceptable DMI values are up to the trader's interpretation and may change depending on the financial instrument being examined. Recommend not changing any default values without being first familiar with their purpose and impact on the indicator at large.
Confidence in price action and trend is higher when two or more indicators are in agreement -- therefore we recommend not using this indicator by itself to determine entry or exit trade opportunities.
Recommend also choosing 'Once Per Bar Close' when creating alerts.
Inputs
---------------------------
ADX Smoothing - the time period to be used in calculating the ADX which has a smoothing component (14 is the Default).
DI Length - the time period to be used in calculating the DI (14 is the Default).
Key Level - any trade with the ADX above the key level is a strong indicator that it is trending (23 to 25 is the suggested setting).
Sensitivity - an incremental variable to test whether the past n candles are in the same bullish or bearish state before triggering a delayed crossover alert (3 is the Default). Filter out some noise and reduces active alerts.
Show ADX Option - two visual styles are provided for user preference, a visible ADX line or a background overlay (green or red when ADX is above the key level, for bullish or bearish, and gray when below).
Color Candles - an option to transpose the bullish and bearish crossovers to the main candle bars. Can be turned off in the Style Tab by deselecting 'Bar Colors'. Dark blue is bullish, dark purple is bearish, and the black inner color is neutral. Note that the outer red and green border will still be distinguished by whether each individual candle is bearish or bullish during the specified timeframe.
Indicator Visuals
---------------------------
Bullish or Bearish plot based on DMI strategy (ADX and +/-DI values).
Visual cues are intended to improve analysis and decrease interpretation time during trading, as well as to aid in understanding the purpose of this study and how its inclusion can benefit a comprehensive trading strategy.
Trend Strength
---------------------------
To analyze trend strength, the focus should be on the ADX line and not the +DI or -DI lines. An ADX reading above 25 indicates a strong trend, while a reading below 20 indicates a weak or non-existent trend. A reading between those two values would be considered indeterminable. Though what is truly a strong trend or a weak trend depends on the financial instrument being examined; historical analysis can assist in determining appropriate values.
Bullish DI Cross
---------------------------
1. ADX must be over 25 (strong trend) (value is determined by the trader)
2. +DI cross above -DI
3. Set Stop Loss at the current day's low (any +DI cross-backs below -DI should be ignored)
4. Set trailing stop if ADX strengthens (i.e., signal rises)
Bearish DI Cross
---------------------------
1. ADX must be over 25 (strong trend) (value is determined by the trader)
2. -DI cross above +DI
3. Set Stop Loss at the current day's high (any -DI cross-backs below +DI should be ignored)
4. Set trailing stop if ADX strengthens (i.e., signal rises)
Disclaimer
---------------------------
This post and the script are not intended to provide any financial advice. Trade at your own risk.
No known repainting.
Version 1.1
-------------------------
- Added multi-timeframe resolution using PineCoders secure security function to eliminate repainting.
- Cleaned up option for selecting ADX view; and added a colored line as a choice, based on same bullish, bearish, or neutral colors as the background.
- Added exit crossover indicator to aid in an overall strategy development. This ability pairs better with my CHOP Zone Entry Strategy which relies on DMI Exits. Note that exit conditions don't employ the sensitivity variable. Green labels are for Bullish exits and red are for Bearish.
-- Exit condition is triggered if in an active Bullish or Bearish position and ADX drops below 25, Or if either the -DI crosses above +DI (for previously Bullish) or +DI crosses above -DI (for previously Bearish).
- Added reverse position determination. Triggers when a Bullish entry occurs on the same candle as a Bearish exit, or vice versa. Green labels are for Bullish reverses and red are for Bearish.
- Added selectable option to choose visible labels -- Bearish, Bullish, Both, Exits, Reverses, or All.
-- Note that a reverse label will only show if the opposing entry and exit labels are set to show, otherwise the reverse will revert to the appropriate entry or exit on the chart.
- Added alerts to account for new conditions.
-- Note that alerts for crossovers, exits, and reverses will only be triggered if the associated labels are selected to be shown (i.e., what you choose to see on the chart is what you will be alerted to).
Version 1.2
-------------------------
- Changed exit condition to be decided on by whether ADX is below 25 and on a +/-DI crossover. Versus being either or. The previous version had too many false triggers. This variety can now show multiple Bullish or Bearish alerts before an Exit condition too. I'm tempted to simply make this condition based on ADX, and not DI … thoughts? See lines 138 and 139.
- Updated the Background view to have deeper shades of colors dependent upon the ADX trend strength.
- Added an Oscillator view for the ADX and momentum computations to color the histogram by trend. DI lines are hidden.
-- If ADX is Bullish, then the oscillator is colored light green in an uptrend and dark green in a downtrend; if Bearish, then its light red in an uptrend and dark redin a downtrend; if adx is below key level, then it is light gray in a downtrend and dark grey in the uptrend.
- Added option to Hide ADX in case only the Directional lines are desired. This could be useful if you would like to have the ADX oscillator in one panel and +/-DI crossovers in another.
- Added a Columnar view for the ADX. DI lines are hidden. This view is really simple and compact, with the trend strength still easily understood. Colors are the same as for the oscillator -- the deeper the shade of green or red, then the higher the ADX trend strength level.
- Added a Trend Strength label.
ADX Trend Strength Trade (Y/N) Setup Types
0 to 10 = Barely Breathing N N/A
10 to 20 = Weak Trend Y Range/Pre-Breakout
20 to 30 = Potentially Starting to Trend Y Early Stage Trend
30 to 50 = Strong Trend Y Ride the Wave
50 to 75 = Very Strong Trend N Exhaustion
75 to 100 = Extremely Strong Trend N N/A
Version 1.3
-------------------------
Updated to Pine Script v5 to resolve errors from the deprecated v4 version.
This is a reissue of a previously published script that was hidden due to a v4 compatibility issue.
'https://www.tradingview.com/script/9OoEHrv5-Directional-Movement-Index-DMI-Alerts/'
DMI

Multi-Time Frame DMI with Gradient Bar ColoringDisplays a table showing the Directional Movement Index (DMI) sentiment for multiple time frames based on the Average Directional Index (ADX) value for each time frame.
Table Position and Text Size are configurable, with two styles (vertical or horizontal) available.
Time frame labels can be toggled off for color-only table.
Bars are colored based on the ADX value using a color gradient between the bullish and bearish color inputs. The neutral color is independent of the gradient for contrast.

DEMA Adaptive DMI [BackQuant]DEMA Adaptive DMI
PLEASE Read the following, knowing what an indicator does at its core before adding it into a system is pivotal. The core concepts can allow you to include it in a logical and sound manner.
Conceptual Foundation and Innovation
The DEMA Adaptive DMI blends the Double Exponential Moving Average (DEMA) with the Directional Movement Index (DMI) to offer a unique approach to trend-following. By applying DEMA to the high and low prices, this indicator refines the traditional DMI calculation, enhancing its responsiveness to price changes. This results in a more adaptive and timely measure of market trends and momentum, providing traders with a more refined tool for capturing directional movements in the market.
Technical Composition and Calculation
At its core, the DEMA Adaptive DMI calculates the DEMA for both the high and low prices over a user-defined period. This dual application of DEMA serves to smooth out price fluctuations while retaining sensitivity to market movements. The DMI is then derived from the changes in these DEMA values, producing a set of plus and minus directional indicators that reflect the prevailing trend. Additionally, an Average Directional Index (ADX) is computed to measure the strength of the trend, with the entire process being dynamically adjusted based on the DEMA calculations.
DEMA Application:
The DEMA is applied to both high and low prices to reduce lag and provide a smoother representation of price action.
Directional Movement Calculation: The DMI is calculated using the smoothed price changes, resulting in plus and minus indicators that accurately reflect market trends.
ADX Calculation:
The ADX is computed to quantify the strength of the trend, offering traders insight into whether the market is trending strongly or is in a phase of consolidation.
Features and User Inputs The DEMA Adaptive DMI offers a range of customizable options to suit different trading styles and market conditions:
DEMA Calculation Period: Users can set the period for the DEMA calculation, allowing for adjustments based on the desired sensitivity.
DMI Length: The length of the DMI calculation can be adjusted, providing flexibility in how trends are measured.
ADX Smoothing Period: The smoothing period for the ADX can be customized to fine-tune the trend strength measurement.
Divergence Detection: Optional divergence detection features allow traders to spot potential reversals based on the DMI and price action.
Visualization options include static high and low levels to mark extreme DMI thresholds, the ability to color bars according to trend direction, and background hues to highlight overbought and oversold conditions.
Practical Applications
The DEMA Adaptive DMI is particularly effective in markets where trend strength and direction are crucial for successful trading. Traders can leverage this indicator to:
Identify Trend Reversals:
Detect potential trend reversals by monitoring the DMI and ADX in conjunction with divergence signals.
Trend Confirmation:
Use the DEMA-based DMI to confirm the strength and direction of a trend, aiding in the timing of entries and exits.
Strategic Positioning:
The indicator's responsiveness allows traders to position themselves effectively in fast-moving markets, reducing the risk of late entries or exits.
Advantages and Strategic Value
By integrating the DEMA with the DMI, this indicator provides a more adaptive and timely measure of market trends. The reduced lag from the DEMA ensures that traders receive signals that are closely aligned with current market conditions, while the dynamic DMI calculation offers a more accurate representation of trend direction and strength. This makes the DEMA Adaptive DMI a valuable tool for traders looking to enhance their trend-following strategies with a focus on precision and adaptability.
Summary and Usage Tips
The DEMA Adaptive DMI is a sophisticated trend-following indicator that combines the benefits of DEMA and DMI into a single, powerful tool. Traders are encouraged to incorporate this indicator into their trading systems for a more nuanced and responsive approach to trend detection and confirmation. Whether used for identifying trend reversals, confirming trend strength, or strategically positioning in the market, the DEMA Adaptive DMI offers a versatile and reliable solution for trend-following strategies.
Thus following all of the key points here are some sample backtests on the 1D Chart
Disclaimer: Backtests are based off past results, and are not indicative of the future.
INDEX:BTCUSD
INDEX:ETHUSD
BINANCE:SOLUSD

Trend Deviation strategy - BTC [IkkeOmar]Intro:
This is an example if anyone needs a push to get started with making strategies in pine script. This is an example on BTC, obviously it isn't a good strategy, and I wouldn't share my own good strategies because of alpha decay.
This strategy integrates several technical indicators to determine market trends and potential trade setups. These indicators include:
Directional Movement Index (DMI)
Bollinger Bands (BB)
Schaff Trend Cycle (STC)
Moving Average Convergence Divergence (MACD)
Momentum Indicator
Aroon Indicator
Supertrend Indicator
Relative Strength Index (RSI)
Exponential Moving Average (EMA)
Volume Weighted Average Price (VWAP)
It's crucial for you guys to understand the strengths and weaknesses of each indicator and identify synergies between them to improve the strategy's effectiveness.
Indicator Settings:
DMI (Directional Movement Index):
Length: This parameter determines the number of bars used in calculating the DMI. A higher length may provide smoother results but might lag behind the actual price action.
Bollinger Bands:
Length: This parameter specifies the number of bars used to calculate the moving average for the Bollinger Bands. A longer length results in a smoother average but might lag behind the price action.
Multiplier: The multiplier determines the width of the Bollinger Bands. It scales the standard deviation of the price data. A higher multiplier leads to wider bands, indicating increased volatility, while a lower multiplier results in narrower bands, suggesting decreased volatility.
Schaff Trend Cycle (STC):
Length: This parameter defines the length of the STC calculation. A longer length may result in smoother but slower-moving signals.
Fast Length: Specifies the length of the fast moving average component in the STC calculation.
Slow Length: Specifies the length of the slow moving average component in the STC calculation.
MACD (Moving Average Convergence Divergence):
Fast Length: Determines the number of bars used to calculate the fast EMA (Exponential Moving Average) in the MACD.
Slow Length: Specifies the number of bars used to calculate the slow EMA in the MACD.
Signal Length: Defines the number of bars used to calculate the signal line, which is typically an EMA of the MACD line.
Momentum Indicator:
Length: This parameter sets the number of bars over which momentum is calculated. A longer length may provide smoother momentum readings but might lag behind significant price changes.
Aroon Indicator:
Length: Specifies the number of bars over which the Aroon indicator calculates its values. A longer length may result in smoother Aroon readings but might lag behind significant market movements.
Supertrend Indicator:
Trendline Length: Determines the length of the period used in the Supertrend calculation. A longer length results in a smoother trendline but might lag behind recent price changes.
Trendline Factor: Specifies the multiplier used in calculating the trendline. It affects the sensitivity of the indicator to price changes.
RSI (Relative Strength Index):
Length: This parameter sets the number of bars over which RSI calculates its values. A longer length may result in smoother RSI readings but might lag behind significant price changes.
EMA (Exponential Moving Average):
Fast EMA: Specifies the number of bars used to calculate the fast EMA. A shorter period results in a more responsive EMA to recent price changes.
Slow EMA: Determines the number of bars used to calculate the slow EMA. A longer period results in a smoother EMA but might lag behind recent price changes.
VWAP (Volume Weighted Average Price):
Default settings are typically used for VWAP calculations, which consider the volume traded at each price level over a specific period. This indicator provides insights into the average price weighted by trading volume.
backtest range and rules:
You can specify the start date for backtesting purposes.
You can can select the desired trade direction: Long, Short, or Both.
Entry and Exit Conditions:
LONG:
DMI Cross Up: The Directional Movement Index (DMI) indicates a bullish trend when the positive directional movement (+DI) crosses above the negative directional movement (-DI).
Bollinger Bands (BB): The price is below the upper Bollinger Band, indicating a potential reversal from the upper band.
Momentum Indicator: Momentum is positive, suggesting increasing buying pressure.
MACD (Moving Average Convergence Divergence): The MACD line is above the signal line, indicating bullish momentum.
Supertrend Indicator: The Supertrend indicator signals an uptrend.
Schaff Trend Cycle (STC): The STC indicates a bullish trend.
Aroon Indicator: The Aroon indicator signals a bullish trend or crossover.
When all these conditions are met simultaneously, the strategy considers it a favorable opportunity to enter a long trade.
SHORT:
DMI Cross Down: The Directional Movement Index (DMI) indicates a bearish trend when the negative directional movement (-DI) crosses above the positive directional movement (+DI).
Bollinger Bands (BB): The price is above the lower Bollinger Band, suggesting a potential reversal from the lower band.
Momentum Indicator: Momentum is negative, indicating increasing selling pressure.
MACD (Moving Average Convergence Divergence): The MACD line is below the signal line, signaling bearish momentum.
Supertrend Indicator: The Supertrend indicator signals a downtrend.
Schaff Trend Cycle (STC): The STC indicates a bearish trend.
Aroon Indicator: The Aroon indicator signals a bearish trend or crossover.
When all these conditions align, the strategy considers it an opportune moment to enter a short trade.
Disclaimer:
THIS ISN'T AN OPTIMAL STRATEGY AT ALL! It was just an old project from when I started learning pine script!
The backtest doesn't promise the same results in the future, always do both in-sample and out-of-sample testing when backtesting a strategy. And make sure you forward test it as well before implementing it!
Furthermore this strategy uses both trend and mean-reversion systems, that is usually a no-go if you want to build robust trend systems .
Don't hesitate to comment if you have any questions or if you have some good notes for a beginner.

ADX Thrust Reversal & Trend
Created by Love Sharma, CMT, CFTe
the idea is simple. there needs to be thrust in prices before adx goes above any barrier or level say 25/10 or even 10/ The Di plus or Di minus should be above ADX. This indicates the change in direction or change in underlying price and obviously followed by ADX indicator which is dependent on user which level it exceed.
The ADX - Shows Trend Strength
The =/- Di show Thrust or reversal in prices.
it helps in entering the directional change in prices early rather than waiting for ADX

Harmonic Trend Fusion [kikfraben]📈 Harmonic Trend Fusion - Your Personal Trading Assistant
This versatile tool combines multiple indicators to provide a holistic view of market trends and potential signals.
🚀 Key Features:
Multi-Indicator Synergy: Benefit from the combined insights of Aroon, DMI, MACD, Parabolic SAR, RSI, Supertrend, and SMI Ergodic Oscillator, all in one powerful indicator.
Customizable Plot Options: Tailor your chart by choosing which signals to visualize. Whether you're interested in trendlines, histograms, or specific indicators, the choice is yours.
Color-Coded Trends: Quickly identify bullish and bearish trends with the color-coded visualizations. Stay ahead of market movements with clear and intuitive signals.
Table Display: Stay informed at a glance with the interactive table. It dynamically updates to reflect the current market sentiment, providing you with key information and trend direction.
Precision Control: Fine-tune your analysis with precision control over indicator parameters. Adjust lengths, colors, and other settings to align with your unique trading strategy.
🛠️ How to Use:
Customize Your View: Select which indicators to display and adjust plot options to suit your preferences.
Table Insights: Monitor the dynamic table for real-time updates on market sentiment and trend direction.
Indicator Parameters: Experiment with different lengths and settings to find the combination that aligns with your trading style.
Whether you're a seasoned trader or just starting, Harmonic Trend Fusion equips you with the tools you need to navigate the markets confidently. Take control of your trading journey and enhance your decision-making process with this comprehensive trading assistant.

Directional Movement Index FLEXA common problem experienced by short term traders using DMI/ADX is that the session breaks results in carry-over effects from the prior session. For example, a large gap up would result in a positive DMI, even though momentum is clearly negative. Note the extremely different results in the morning session, when the gap is reversed.
The DMI-FLEX algoritm resets the +DI and -DI values to the prior session ending midpoint, so that new momentum can be observed from the indicator. (Note for Pinescript coders: rma function does not accept series int, thus the explicit pine_rma function)
DMI-FLEX has the added feature that the ADX value, instead of a separate line, is shown as shading between the +DI and -DI lines, and the color itself is determined by whether +DI is above -DI for a bullish color, or -DI is above +DI for a bearish color.
DMI Flex also gives you the flexibility of inverse colors, in case your chart has inverted scale.
Summary and How to use:
1) Green when +DI is above -DI
2) Red when -DI is above +DI
3) Deeper shading represents a higher ADX value.

ADXcellenceThis advanced trading indicator, inspired by Dr. Charles B. Schaap's book "ADXcellence: Power Trend Strategies", leverages the principles of the Average Directional Index (ADX) to help traders identify and exploit trending conditions in the market.
The ADXcellence Indicator uses multiple levels of analysis to evaluate the strength and direction of trends.
In addition to the classic ADX+DMI input settings, these features are included:
ADX Slope Signal: This parameter, controls the sensitivity of the ADX slope, which will indicate when the trend strength is increasing or decreasing.
The indicator provides three trend levels: strong trend level, trending level, and low volatility level, which can be customized to suit various trading strategies.
The color gradients for the ADX, DI+, and DI- lines are designed to visually represent the trend strength from the low volatility level to the strong trend level. The indicator also uses a dynamic background color, highlighting the periods when the ADX is rising. The color will vary depending on the dominant DI.
The ADXcellence Indicator also offers a unique feature of dynamically adjusting the fill between DI+ and DI-, with the color and fill intensity changing based on the relative value of the two.
This indicator is a powerful tool for traders who use trend-following strategies and is best used in conjunction with other technical analysis tools to confirm signals and avoid potential false signals.
Remember, no indicator is perfect and every trading strategy should include risk management and proper due diligence.
Enjoy :)

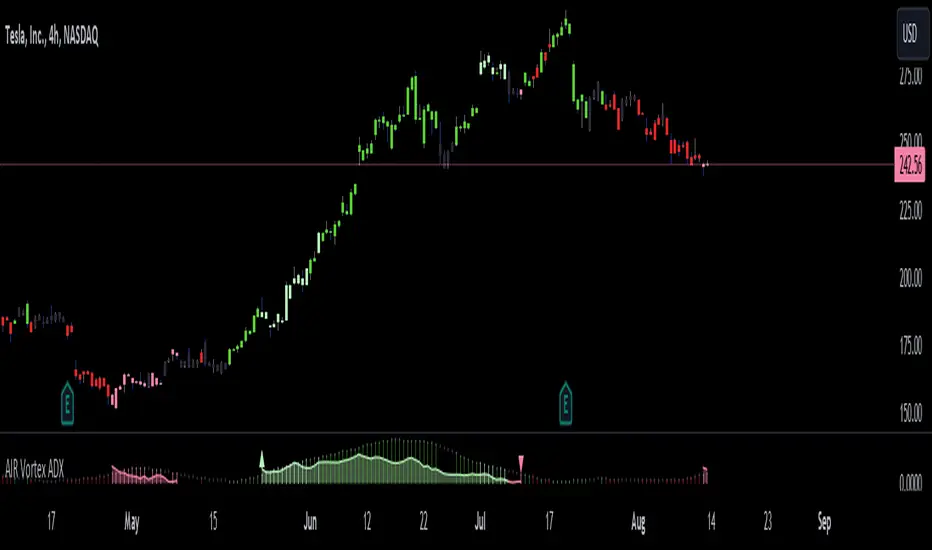
AIR Vortex ADXThis project started as an effort to improve the user interface of the hybrid indicator ADX of Vortex, which is, as per the name, a blend of ADX and Vortex Indicator. Plotting both indicators on the same polarity and normalising the vortex, a better interpretation of the interaction between the two is possible, and trend becomes apparent.
Basically, the Vortex provides the bright punch and ADX the continuation of the trend and momentum.
A range mixer has been added to the vortex, comprising both true and interpercentile ranges (see my previous script for a desrciption of interpercentile range). Users can activate and add amounts of each as they see fit.
Finally, there is an RSI filter, the idea of which is to filter out ranging (flat) markets, where no distinct direction is yet emerging.
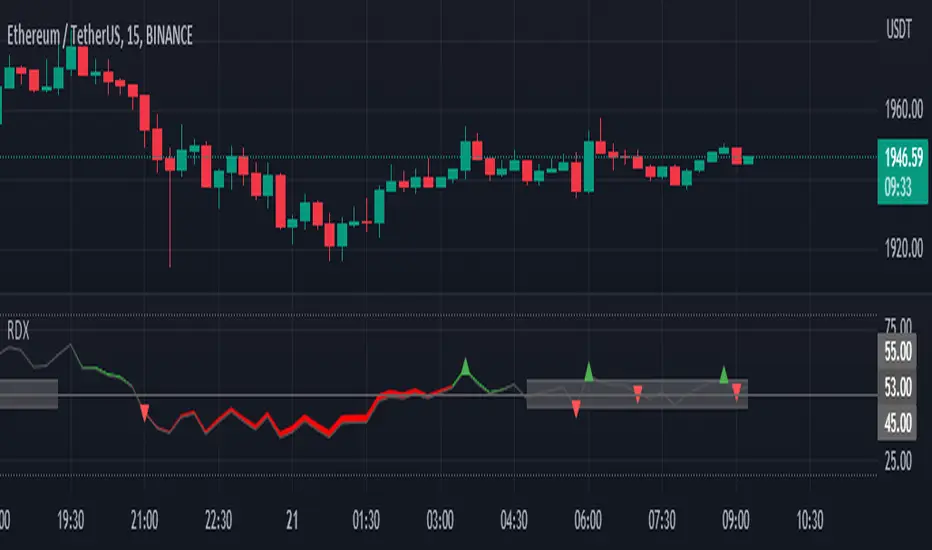
RDX Relative Directional IndexRDX Relative Directional Index, Strength + Direction + Trend. This indicator is the combination of RSI and DMI or ADX. RDX aims at providing Relative direction of the price along with strength of the trend. This acts as both RSI and Average Directional Index. as the strength grows the RSI line becomes wider and when there is high volatility and market fluctuation the line becomes thinner. Color decides the Direction. This indicator provides sideways detection of RSI signal.
RDX Width: This determines the strength of RSI and Strength of ADX, The strength grows RDX band grows wider, as strength decreases band shrinks and merge into the RSI line. for exact working simply disable RSI plot on the indicator. when there is no strength the RSI vanishes..
Technical:
RSI : with default 14 period
ADX : Default 14 period
RDX=RSI+(ADX-20)/5
Color Code:
Red: Down Direction
Green: Up Direction
Sideways:
A rectangular channel is plotted on RSI 50 Level
Oversold Overbought:
Oversold and Overbought Levels are plotted for normal RSI Oversold and Overbought detection.
Buy/Sell:
Buy sell signals from ADX crossover are plotted and its easy to determine
Strength + Direction + Trend in one go
Hope the community likes this...
Contibute for more ideas and indicators..
RiverFlow ADX ScreenerRiverFlow ADX Screener, Scans ADX and Donchian Trend values across various Timeframes. This screener provides support to the Riverflow indicator. Riverflow concept is based on Two indicators. Donchian Channel and ADX or DMI.
How to implement?
1.Donchian Channel with period 20
2. ADX / DMI 14,14 threshold 20
Entry / Exit:
1. Buy/Sell Signal from ADX Crossovers.
2. Trend Confirmation Donchian Channel.
3. Major Trend EMA 200
Buy/Sell:
After a buy/sell is generated by ADX Crossover, Check for Donchian Trend. it has to be in same direction as trend. for FTT trades take 2x limit. for Forex and Stocks take 1:1.5, SL must be placed below recent swing. One can use Riverflow indicator for better results.
ADX Indicator is plotted with
Plus: Green line
Minus: Red Line
ADX strength: plotted as Background area.
TREND: Trend is represented by Green and Red Area around Threshold line
Table:
red indicates down trend
green indicates up trend
grey indicates sideways
Weak ADX levels are treated sideways and a channel is plotted on ADX and PLUS and MINUS lines . NO TRADES are to be TAKEN on within the SIDEWAYS region.
Settings are not required as it purely works on Default settings. However Donchian Length can be changed from settings.
Timeframes below 1Day are screened. Riverflow strategy works on timeframe 5M and above timeframe. so option is not provided for lower timeframes.
Best suits for INTRADAY and LONG TERM Trading

ADX Trend FilterADX Trend Filter Indicator is a traditional ADX indicator with a different presentation. its consist of two indicators EMA TREND and ADX / DMI
About Indicator:
1. BAND / EMA band to represent EMA Trend of EMA-12 and EMA-50
(Band is plotted at level-20 which is the Threshold level of DMI / ADX indicator)
2. Histogram showing the direction of ADX / DMI trend
3. Area behind the histogram showing ADX/DMI strength
How to use?
1. Histogram represents current Trend Red for Bearish / Green for Bullish
2. Area behind the histogram represents Strength of ADX / DMI Threshold level is 0-20(represented as band). (Area below the Band is Sideways)
3. Band represents the current MA Trend.
4. Buy Sell signals are plotted as triangles in red/green obtained from ADX / DMI Crossovers
Buy Signal (Green Triangle on band- ADX Crossover)
1.Band below Histogram must be Green
2.Histogram must be green
3.Area behind histogram must be above the lower trend band (20level) and visible
Sell Signal (Red Triangle on band- ADX Crossover)
1.Band below Histogram must be Red
2.Histogram must be Red
3.Area behind histogram must be above the lower trend band (20level) and visible
Alerts provided for ADX crossovers.

TrendIndicatorsLibrary "TrendIndicators"
This is a library of 'Trend Indicators'.
It aims to facilitate the grouping of this category of indicators, and also offer the customized supply of
the source, not being restricted to just the closing price.
Indicators (this is a work in progress):
1. Absolute DI (Directional Moviment Index) (Difference between DI+ and DI-).
Used in 'DMI Stochastic Extreme' by Barbara Star.
2. DMI
DI_Abs(lengthDI, smoothDI, typeMA, lengthMA)
@description Absolute DI (Directional Moviment Index).
Used in 'DMI Stochastic Extreme' by Barbara Star.
Difference between DI+ and DI-
Parameters:
lengthDI : (int) Length of DI+/DI-
smoothDI : (bool) Sets whether absolute DI should be smoothed
typeMA : (int) Type of moving average of smoothing
lengthMA : (int) Length for moving average of smoothing
Returns: (float) Absolute value of DI
dmi(diLength, adxSmoothing)
@description DMI (Directional Movement Index)
Same as ta.dmi()
Parameters:
diLength : (int) Length of DI+/DI-
adxSmoothing : (int) ADX Smoothing
Returns: Tuple of three DMI series: Positive Directional
Movement (+DI), Negative Directional Movement (-DI) and Average Directional Movement Index (ADX).
dmi(source, diLength, adxSmoothing)
@description DMI (Directional Movement Index)
Customized version of ta.dmi(), with custom source
Parameters:
source : (float) Source for DI+/DI-
diLength : (int) Length of DI+/DI-
adxSmoothing : (int) ADX Smoothing
Returns: Tuple of three DMI series: Positive Directional
Movement (+DI), Negative Directional Movement (-DI) and Average Directional Movement Index (ADX).
SumIndTarget:
The SumInd indicator combines Heiking Ashi, Sar Parabolic, Koncord, RSI, DMI, MACD and Bollinger Bands to give buy or sell signals or trends. This are called base indicators.
The goal is to have a clear and quick buy or sell suggestion and to avoid evaluating all or some of the named indicators, especially if they give contradictory signals among them. This speed and simplicity helps the trader to see several tickers in less time. It is intended for all markets and time periods where the above-mentioned indicators can be used.
How it works:
SumInd already has the importance or "weight" of each indicator named above configured, but they can be modified. You can set 0% for no use, or any other value based on the weight you want to give it, between 1% and 200% where 100% is the normal use, and increases or decreases based on importance.
Each base indicator can give signals to buy, sell or just "wait and see".
Each base indicator is checked for a buy signal, in which case its weight is added to the positive or green line, and if there is a sell signal, its weight is subtracted from the sell or red line. in case of indeterminacy or 'wait and see', nothing is added to any signal.
The yellow or total line is the sum of the buy or green signal plus the sell or red signal.
If the yellow or total line rises above the buy level, the background changes to green and an up arrow appears at the bottom of the chart indicating the buy suggestion, because most of the indicators you are interested in gave a buy signal.
If the yellow line or total falls below the sell level, the background changes to red and a downward arrow appears in the upper area of the chart indicating the sell suggestion, because most of the indicators you are interested in gave a sell signal.
The Buy and Sell level can be changed according to the security of the suggestion you need.
Areas without arrows or marks are considered "wait and see" areas, the previous trend in principle continues. They can be marked with the default background if desired from the SumInd settings.
Details and criterials:
Each of the following indicators can be turned on or off and assigned different weights of importances, by whether or not it shares the following criteria:
Heikin Ashi candles: add or subtract half an assigned weight if there is a buy or sell candle and the other half weight if there are two consecutive candles with the same signal.
RSI: Adds or subtracts the assigned weight if the ema is below or above the signal.
Parabolic Sar: Adds half a weight in transition to buy or sell and another half weight if there are two consecutive signals of the same trend.
Koncord: Add or subtract the weight if the current trend (mountain) grows or decreases respectively from the 4th previous time signal, and also the value (red line) is less than 35 or exceeds 65 respectively.
DMI: Adds or subtracts a quarter of the weight assigned by the DMI signal multiplied by the value of DMI, if the positive or negative signal exceeds the other negative or positive signal by 15% respectively.
Bollinger Bands: Add or subtract the weight if the previous third signal touches or falls out of the zone and keeps growing or decreasing respectively.
MACd: Add or subtract one third of the weight if the last 3 time signals are rising or falling, Add or subtract another third if the fast signal is above or below the slow signal, and Add or subtract the last third of the weight if it is rising with the negative fast signal, or falling with the positive fast signal.

Ichimoku Cloud and ADX with Trailing Stop Loss (by Coinrule)The Ichimoku Cloud is a collection of technical indicators that show support and resistance levels, as well as momentum and trend direction. It does this by taking multiple averages and plotting them on a chart. It also uses these figures to compute a “cloud” that attempts to forecast where the price may find support or resistance in the future.
The Ichimoku Cloud was developed by Goichi Hosoda, a Japanese journalist, and published in the late 1960s. It provides more data points than the standard candlestick chart. While it seems complicated at first glance, those familiar with how to read the charts often find it easy to understand with well-defined trading signals.
The Ichimoku Cloud is composed of five lines or calculations, two of which comprise a cloud where the difference between the two lines is shaded in.
The lines include a nine-period average, a 26-period average, an average of those two averages, a 52-period average, and a lagging closing price line.
The cloud is a key part of the indicator. When the price is below the cloud, the trend is down. When the price is above the cloud, the trend is up.
The above trend signals are strengthened if the cloud is moving in the same direction as the price. For example, during an uptrend, the top of the cloud is moving up, or during a downtrend, the bottom of the cloud is moving down.
DMI is simple to interpret. When +DI > - DI, it means the price is trending up. On the other hand, when -DI > +DI , the trend is weak or moving on the downside. The ADX does not give an indication about the direction but about the strength of the trend.
Typically values of ADX above 25 mean that the trend is steeply moving up or down, based on the -DI and +D positioning. This script aims to capture swings in the DMI, and thus, in the trend of the asset, using a contrarian approach.
Trading on high values of ADX, the strategy tries to spot extremely oversold and overbought conditions. Values of ADX above 45 may suggest that the trend has overextended and is may be about to reverse.
This strategy combines the Ichimoku Cloud with the ADX indicator to better enter trades.
Long orders are placed when these basic signals are triggered.
Long Position:
Tenkan-Sen is above the Kijun-Sen
Chikou-Span is above the close of 26 bars ago
Close is above the Kumo Cloud
MACD line crosses over the signal line
-DI is greater than +DI
ADX is greater than 45
Close Position:
3% increase trailing
3% decrease trailing
The script is backtested from 1 January 2018 and provides good returns.
The strategy assumes each order is using 30% of the available coins to make the results more realistic and to simulate you only ran this strategy on 30% of your holdings. A trading fee of 0.1% is also taken into account and is aligned to the base fee applied on Binance.
This script also works well on MATIC (1d timeframe), ETH (1d timeframe), and SOL (1d timeframe).

Directional Movement Indicator (DMI and ADX) - TartigradiaDirection Movement Indicator (DMI) is a trend indicator invented by Welles Wilder, who also authored RSI.
DMI+ and DMI- respectively indicate pressure towards bullish or bearish trends.
ADX is the average directional movement, which indicates whether the market is currently trending (high values above 25) or ranging (below 20) or undecided (between 20 and 25).
DMX is the non smoothed ADX, which allows to detect transitions from trending to ranging markets and inversely with zero lag, but at the expense of having much more noise.
This is an extended indicator, from the original one by BeikabuOyaji, please show them some love if you appreciate this indicator:
Usage: To use this indicator for entry: when DMI+ crosses over DMI-, there is a bullish sentiment, however ADX also needs to be above 25 to be significant, otherwise the move is not necessarily sustainable.
Inversely, when DMI+ crosses under DMI- and ADX is above 25, then the sentiment is significantly bearish, but if ADX is below 20, the signal should be disregarded.
This indicator automatically highlights the background in green when ADX is above 25, and in red when ADX is below 20, to ease interpretation.
Also, arrows can be activated in the Style menu to automatically show when the two conditions described above are met, or these can be used in a strategy.

DMI Stochastic Momentum IndexConcepts
This is an improved version of the "DMI Stochastic Extreme Refurbished" indicator.
For more information on the main concepts of this indicator, please access this link:
The difference is that here, instead of using the traditional stochastic oscillator, I implemented the use of the Stochastic Momentum Index (SMI).
Stochastic Momentum Index (SMI)
The SMI is considered a refinement of the stochastic oscillator.
It calculates the distance of the current closing price as it relates to the median of the high/low range of price.
William Blau developed the SMI, which attempts to provide a more reliable indicator, less subject to false swings.
The original stochastic is limited to values from 0 to 100, while the SMI varies between the range of -100 to 100.
(Investopedia)
It is worth mentioning that the SMI presented in this script applies to the DMI value, not the screen price.

Directional Movement RibbonWhat makes this different from directional movement index?
The aim is to reduce the amount of data analysis necessary before taking action; currently using DMI requires reviewing the DM+ and DM- plots, and ADX as well as review the overall trend of each one. Also there is the final analysis to determine whether a strong trend hasn’t been established at all.
This indicator condenses the information found from the standard DMI into an intuitive colored ribbon that reveals direction and strength at a glance.
How to use it?
Review the ribbon for sentiment based on color, green being bullish and red being bearish, (if using default color scheme). The brightness of the color determines the strength of the sentiment, brightest being strongest. If no color is represented at all then it is due to weakness and/or lack of direction.
Features
All colors customizable
Toggle display of indecision areas
Adjust levels considered strong, weak trends
Which markets is this meant for?
This can be used in any market, though it’s recommended to use with liquid markets where direction and strength can be found often.
What conditions?
Recommend to utilize with key levels and most commonly utilized moving average periods such as 20, 50, 100 or 200.

CFB-Adaptive, Jurik DMX Histogram [Loxx]Jurik DMX Histogram is the ultra-smooth, low lag version of your classic DMI indicator. This is a momentum indicator. You can use this indicator standalone or as part of a system with a moving average and a mean reversion indicator. This indicator has both composite fractal behavior adaptive inputs and fixed inputs. The default is CFB adaptive. Dark green means strong push up, dark red, strong push down. Light green means weak push up, and light red means weak push down.
What is the directional movement index?
The directional movement index (DMI) is an indicator developed by J. Welles Wilder in 1978 that identifies in which direction the price of an asset is moving. The indicator does this by comparing prior highs and lows and drawing two lines: a positive directional movement line ( +DI ) and a negative directional movement line ( -DI ). An optional third line, called the average directional index ( ADX ), can also be used to gauge the strength of the uptrend or downtrend.
When +DI is above -DI , there is more upward pressure than downward pressure in the price. Conversely, if -DI is above +DI , then there is more downward pressure on the price. This indicator may help traders assess the trend direction. Crossovers between the lines are also sometimes used as trade signals to buy or sell.
What is Composite Fractal Behavior ( CFB )?
All around you mechanisms adjust themselves to their environment. From simple thermostats that react to air temperature to computer chips in modern cars that respond to changes in engine temperature, r.p.m.'s, torque, and throttle position. It was only a matter of time before fast desktop computers applied the mathematics of self-adjustment to systems that trade the financial markets.
Unlike basic systems with fixed formulas, an adaptive system adjusts its own equations. For example, start with a basic channel breakout system that uses the highest closing price of the last N bars as a threshold for detecting breakouts on the up side. An adaptive and improved version of this system would adjust N according to market conditions, such as momentum, price volatility or acceleration.
Since many systems are based directly or indirectly on cycles, another useful measure of market condition is the periodic length of a price chart's dominant cycle, (DC), that cycle with the greatest influence on price action.
The utility of this new DC measure was noted by author Murray Ruggiero in the January '96 issue of Futures Magazine. In it. Mr. Ruggiero used it to adaptive adjust the value of N in a channel breakout system. He then simulated trading 15 years of D-Mark futures in order to compare its performance to a similar system that had a fixed optimal value of N. The adaptive version produced 20% more profit!
This DC index utilized the popular MESA algorithm (a formulation by John Ehlers adapted from Burg's maximum entropy algorithm, MEM). Unfortunately, the DC approach is problematic when the market has no real dominant cycle momentum, because the mathematics will produce a value whether or not one actually exists! Therefore, we developed a proprietary indicator that does not presuppose the presence of market cycles. It's called CFB (Composite Fractal Behavior) and it works well whether or not the market is cyclic.
CFB examines price action for a particular fractal pattern, categorizes them by size, and then outputs a composite fractal size index. This index is smooth, timely and accurate
Essentially, CFB reveals the length of the market's trending action time frame. Long trending activity produces a large CFB index and short choppy action produces a small index value. Investors have found many applications for CFB which involve scaling other existing technical indicators adaptively, on a bar-to-bar basis.
What is Jurik Volty used in the Juirk Filter?
One of the lesser known qualities of Juirk smoothing is that the Jurik smoothing process is adaptive. "Jurik Volty" (a sort of market volatility ) is what makes Jurik smoothing adaptive. The Jurik Volty calculation can be used as both a standalone indicator and to smooth other indicators that you wish to make adaptive.
What is the Jurik Moving Average?
Have you noticed how moving averages add some lag (delay) to your signals? ... especially when price gaps up or down in a big move, and you are waiting for your moving average to catch up? Wait no more! JMA eliminates this problem forever and gives you the best of both worlds: low lag and smooth lines.
Ideally, you would like a filtered signal to be both smooth and lag-free. Lag causes delays in your trades, and increasing lag in your indicators typically result in lower profits. In other words, late comers get what's left on the table after the feast has already begun.
Included:
Alerts
Loxx's Expanded Source Types
Signals
Bar coloring

DMI StrategyThis strategy is based on DMI indicator. It helps me to identify base or top of the script. I mostly use this script to trade in Nifty bank options, even when the signal comes in nifty . It can be used to trade in other scripts as well. Pivot points can also be used to take entry. Long entry is taken when DI+(11) goes below 10 and DI-(11) goes above 40 , whereas short entry is taken when DI-(11) goes below 10 and DI+(11) goes above 40.
For bank nifty , I take the trade in the strike price for which the current premium is nearby 300, with the SL of 20%. If premium goes below 10% I buy one more lot to average, but exit if the premium goes below 20% of the first entry. If the trade moves in the correct direction, we need to start trailing our stoploss or exit at the pre-defined target.
As this a strategy, there is one problem. While we are in the phase of "long", if again the "long" phase comes, it will not be shown on chart until a "short" phase has come, and vice versa. This has been resolved by creating an indicator instead of strategy with the name of "DMI Buy-sell on chart". Please go through that to get more entry points.
Please have a look at strategy tester to back test

DMI StrategyThis strategy is based on DMI indicator. It helps me to identify base or top of the script. I mostly use this script to trade in Nifty bank options, even when the signal comes in nifty. It can be used to trade in other scripts as well. Pivot points can also be used to take entry. Long entry is taken when DI+(11) goes below 10 and DI-(11) goes above 40, whereas short entry is taken when DI-(11) goes below 10 and DI+(11) goes above 40.
For bank nifty, I take the trade in the strike price for which the current premium is nearby 300, with the SL of 20%. If premium goes below 10% I buy one more lot to average, but exit if the premium goes below 20% of the first entry. If the trade moves in the correct direction, we need to start trailing our stoploss or exit at the pre-defined target.
Please have a look at strategy tester to back test.

VIDYA DMI Oscillator w/ DSL Levels [Loxx]VIDYA DMI Oscillator w/ DSL Levels is a VIDYA smoothed Direction Movement Index with Discontinued Signals. These two add on features allow for more accurate signals by reducing noise.
What is the Direction Movement Index?
Within the suite of indicators that make up Wilder’s directional movement index (DMI) are the plus directional movement indicator (+DI) and the minus directional movement indicator (-DI). They provide the foundation for the more widely recognized average directional index (ADX). Whereas the ADX offers information about the strength of price movement but not its direction, the +DI and -DI furnish information about the positive or negative direction of price movement over a period of time.
Wilder provides complete information about the function and construction of all the components that make up the directional movement index in his 1978 book, New Concepts In Technical Trading Systems. In general, the plus and minus components of the DMI focus on that portion of the current bar’s trading range that is outside the range of the previous price bar. If it is higher, it is considered to be positive (+) and if it is lower, it is labeled negative (-). These values are divided by the true range and averaged over time, usually 14 periods. A move by the +DI above the -DI indicates that positive or upward price direction has overtaken negative or downward price direction. Conversely, when +DI falls below -DI, declining price either from selling pressure or lack of upward price momentum is taking control. Potential changes in direction or trend occur when the lines intersect.
What is VIDYA?
VIDYA (Chande's Variable Index Dynamic Average) is an adaptive weighted moving average indicator. It was developed by Tushar Chande as an attempt to improve the performance of the EMA (Exponential Weighted Moving Average) indicator.
Included:
Bar coloring
3 signal variations w/ alerts
4 intermediate smoothing types
Loxx's Expanded Source Types
DMI Stochastic Extreme Refurbished█ CONCEPTS
DMI Stochastic Extreme was originally published by Barbara Star, PhD, in TASC magazine of January 2013.
Basically it describes an improved version of the ADX DI+/DI- indicator, created by J. Welles Wilder.
In the setup described by the author, the DMI Oscillator is used together with a stochastic oscillator of DMI.
First, the DMI Oscillator is obtained by subtracting the minus directional movement indicator value (DI-) from the plus directional movement value (DI+).
The final result is the "DMI Stochastic Extreme" indicator, in which the stochastic oscillator is calculated. Only instead of using the price value, the stochastic is obtained through the DMI value.
█ Goals
The final indicator described by Barbara is the Stochastic Oscillator of DMI.
However, to use the DMI oscillator together (as described in the magazine), it is necessary to plot it in a separate indicator, which consumes screen space.
That's why the idea of joining both the DMI oscillator and the DMI Stochastic Oscillator into one thing came up, optimizing the visualization.
Taking advantage of the fact that my hands are already dirty :), I created some fine adjustments.
█ HOW TO USE IT
Here are some examples:
1. With default params:
2. With custom DI Length of 21 (Histogram), DI Length of 13 (for Stoch Oscilator), Stoch Length of 5, and another theme.
3. Another params with less noise:
█ THANKS AND CREDITS
- Barbara Star (original creator)
- ucsgears (arrow logic)
