OPEN-SOURCE SCRIPT
已更新 Bullish vs. Bearish Candle Counter
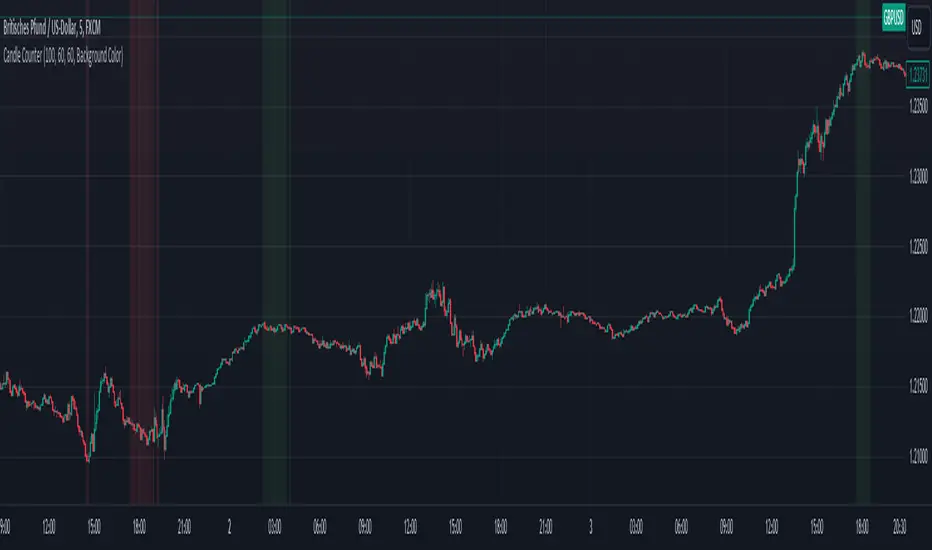
Following an exhaustive analysis of the most recent 50,000 candles within a given currency pair, a notable equilibrium between bearish and bullish candles has emerged as a persistent market phenomenon. This equilibrium, indicative of the market's continuous endeavor to establish parity, has spurred the development of the following indicator.
The indicator meticulously scrutinizes the preceding 100 candles, promptly triggering an on-chart marker when either bullish or bearish candle counts surpass the threshold of 60%. This marker serves as an invaluable tool, providing traders with a potential signal for the initiation of a trend reversal.
As such, this indicator serves as a valuable asset in a trader's toolkit, offering insights into shifts in market sentiment and the prospect of emerging trends.
Key Features:
- Customizable Candle Count: Traders can set the number of candlesticks to be analyzed in the input parameters, allowing flexibility in their analysis.
- Bullish and Bearish Percentage: Users can define their desired percentage for both bullish and bearish candles in the indicator's settings. The indicator calculates the percentage of each candle type within the specified range.
- Arrow Signals: The indicator plots arrows above or below the current candle, indicating bullish or bearish conditions based on the defined percentage thresholds. A green arrow signifies bullish sentiment, while a red arrow denotes bearish sentiment.
How to Use:
- Adjust Parameters: In the indicator settings, users can customize the number of candlesticks to be analyzed, as well as set their preferred percentages for both bullish and bearish conditions.
- Interpret Arrows: The indicator generates arrows above or below the current candle, reflecting the prevailing market sentiment. A green arrow suggests a bullish bias, while a red arrow indicates a bearish bias.
- Trade with Confidence: Traders can use this indicator as a tool to gauge market sentiment and make informed trading decisions. It helps identify potential entry and exit points based on the chosen percentage thresholds.
發行說明
You can now switch between the options of a colored background and arrows.開源腳本
本著TradingView的真正精神,此腳本的創建者將其開源,以便交易者可以查看和驗證其功能。向作者致敬!雖然您可以免費使用它,但請記住,重新發佈程式碼必須遵守我們的網站規則。
免責聲明
這些資訊和出版物並不意味著也不構成TradingView提供或認可的金融、投資、交易或其他類型的意見或建議。請在使用條款閱讀更多資訊。
免責聲明
這些資訊和出版物並不意味著也不構成TradingView提供或認可的金融、投資、交易或其他類型的意見或建議。請在使用條款閱讀更多資訊。