PROTECTED SOURCE SCRIPT
Smart Money Liquidity Zones Pro
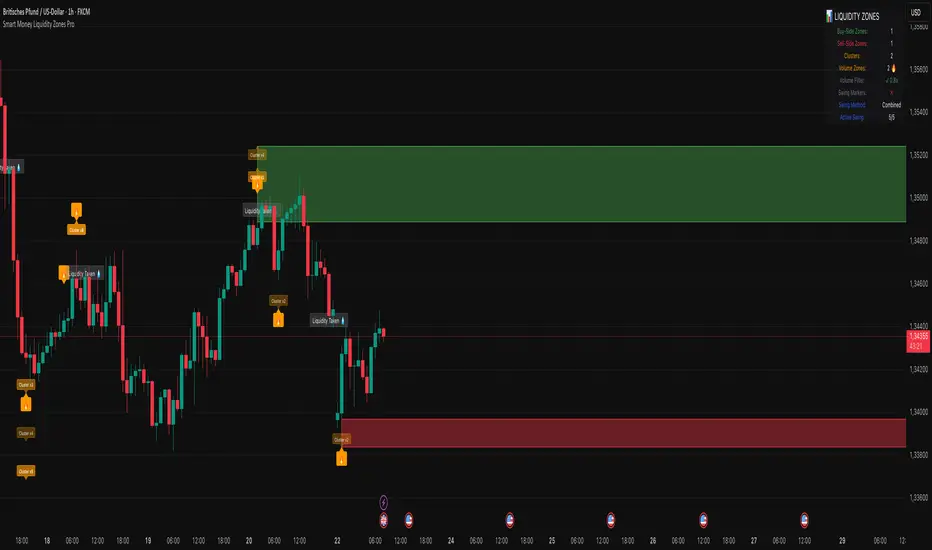
The Smart Money Liquidity Zones Pro indicator identifies and visualizes key liquidity areas in the market where institutional traders (smart money) are likely to have placed their stop-loss orders. These zones represent areas of high liquidity that often act as magnets for price, making them valuable reference points for trading decisions.
What the Indicator Does
Core Functionality
Zone Types
Trading Strategies
Basic Concepts
Entry Strategies
Strategy 1: Liquidity Grab Reversal
Strategy 2: Zone Break Continuation
Strategy 3: Zone Clustering Trade
Risk Management
Settings Explanation
Swing Detection Settings
Swing Strength (Lookback Bars) [Default: 5]
Adaptive Swing Detection [Default: Enabled]
Minimum Bars for Swing [Default: 2]
Swing Detection Method [Default: Combined]
Auto-Adjust for Timeframe [Default: Enabled]
Zone Settings
Max Number of Visible Zones [Default: 10]
Max Zone Duration (Bars) [Default: 50]
Enable Zone Clustering [Default: Enabled]
Cluster Threshold (%) [Default: 0.5%]
Show Cluster Labels [Default: Enabled]
Volume Filter Settings
Enable Volume Filter [Default: Disabled]
Volume Multiplier [Default: 0.8]
Volume SMA Period [Default: 20]
Show Volume Confirmation Icon [Default: Enabled]
Volume Visualization Settings
Show Volume Dots [Default: Disabled]
Dynamic Zone Colors [Default: Enabled]
Show Volume Background [Default: Disabled]
Visual Settings
Buy-Side/Sell-Side Zone Colors
Border Width [Default: 1]
Show 'Liquidity Taken' Labels [Default: Enabled]
Label Size [Default: Small]
Show Swing Point Markers [Default: Disabled]
Show Debug Info [Default: Disabled]
Dashboard Settings
Show Dashboard [Default: Enabled]
Dashboard Position [Default: Top Right]
Background Color [Default: Black 90% opacity]
Text Color [Default: White]
Text Size [Default: Tiny]
Tips for Effective Use
Common Issues and Solutions
No zones appearing:
Too many zones:
Zones disappearing too quickly:
Poor performance on higher timeframes:
What the Indicator Does
Core Functionality
- Swing Point Detection: The indicator identifies significant swing highs and lows using three different methods (Classic, Fractal, or Combined) to locate potential liquidity pools.
- Liquidity Zone Creation: At each valid swing point, the indicator creates a horizontal zone representing an area where stop-loss orders are likely clustered.
- Zone Clustering: When multiple swing points occur near the same price level, the indicator intelligently combines them into larger cluster zones, indicating stronger liquidity areas.
- Volume Confirmation: The indicator can filter zones based on volume, showing only those swing points that occurred with significant trading volume.
- Zone Break Detection: When price closes through a liquidity zone, the indicator marks it as "Liquidity Taken" and removes the zone from the chart.
Zone Types
- Buy-Side Liquidity Zones (Green): Created at swing highs where short sellers' stop-losses are likely placed
- Sell-Side Liquidity Zones (Red): Created at swing lows where long traders' stop-losses are likely placed
Trading Strategies
Basic Concepts
- Liquidity Runs: Price often moves toward these zones to trigger stop-loss orders before reversing. This creates trading opportunities.
- Support and Resistance: Unbroken liquidity zones can act as support (sell-side) or resistance (buy-side) levels.
- Breakout Confirmation: When price breaks through a zone with strong momentum, it often continues in that direction.
Entry Strategies
Strategy 1: Liquidity Grab Reversal
- Wait for price to spike into a liquidity zone
- Look for rejection candles (wicks) at the zone
- Enter in the opposite direction after confirmation
- Place stop-loss beyond the liquidity zone
Strategy 2: Zone Break Continuation
- Wait for price to close decisively through a zone
- Enter on the retest of the broken zone
- Target the next liquidity zone in the direction of the break
Strategy 3: Zone Clustering Trade
- Focus on areas with multiple overlapping zones (clusters)
- These areas offer higher probability setups
- Trade bounces from cluster zones with tighter risk management
Risk Management
- Always use stop-losses beyond the liquidity zones
- Consider the overall market context and trend
- Zones on higher timeframes are generally more significant
- Volume-confirmed zones have higher reliability
Settings Explanation
Swing Detection Settings
Swing Strength (Lookback Bars) [Default: 5]
- Determines how many bars to look back for swing point validation
- Higher values find more significant swings but fewer zones
- Recommended settings:
1m-5m charts: 3-5
15m-1h charts: 5-8
Daily charts: 5-10
Weekly charts: 3-5
Monthly charts: 2-3
Adaptive Swing Detection [Default: Enabled]
- Automatically adjusts swing detection based on available historical data
- Prevents errors when there's limited chart history
- Recommended to keep enabled
Minimum Bars for Swing [Default: 2]
- Sets the absolute minimum bars required for swing detection
- Lower values allow detection in limited data conditions
Swing Detection Method [Default: Combined]
- Classic: Strict price comparison for pure swing highs/lows
- Fractal: Williams Fractal pattern (2 bars on each side)
- Combined: Uses both methods for maximum zone detection
Auto-Adjust for Timeframe [Default: Enabled]
- Automatically optimizes settings based on chart timeframe
- Prevents inappropriate settings on higher timeframes
Zone Settings
Max Number of Visible Zones [Default: 10]
- Limits the number of zones displayed to prevent chart clutter
- Older zones are automatically removed
Max Zone Duration (Bars) [Default: 50]
- Zones older than this are automatically deleted
- Keeps the chart focused on recent liquidity areas
Enable Zone Clustering [Default: Enabled]
- Groups nearby zones into larger clusters
- Identifies stronger liquidity areas
Cluster Threshold (%) [Default: 0.5%]
- Maximum price distance for zones to be clustered
- Lower values create tighter clusters
Show Cluster Labels [Default: Enabled]
- Displays "Cluster x2", "Cluster x3" etc. on grouped zones
Volume Filter Settings
Enable Volume Filter [Default: Disabled]
- When enabled, only creates zones at high-volume swing points
- Increases zone quality but reduces quantity
Volume Multiplier [Default: 0.8]
- Multiplier for average volume to determine "high volume"
- Lower values (0.7-0.9) create more zones
- Higher values (1.2+) create fewer, higher-quality zones
Volume SMA Period [Default: 20]
- Period for calculating average volume
- Higher values create smoother volume baseline
Show Volume Confirmation Icon [Default: Enabled]
- Displays a fire emoji on volume-confirmed zones
Volume Visualization Settings
Show Volume Dots [Default: Disabled]
- Displays dots below high-volume bars
Dynamic Zone Colors [Default: Enabled]
- Volume-confirmed zones appear with more intense colors
Show Volume Background [Default: Disabled]
- Highlights the chart background on high-volume bars
Visual Settings
Buy-Side/Sell-Side Zone Colors
- Customize colors for long and short liquidity zones
Border Width [Default: 1]
- Thickness of zone borders (1-3)
Show 'Liquidity Taken' Labels [Default: Enabled]
- Displays labels when zones are broken
Label Size [Default: Small]
- Size of the liquidity taken labels
Show Swing Point Markers [Default: Disabled]
- Displays triangles at detected swing points
Show Debug Info [Default: Disabled]
- Shows diagnostic information for troubleshooting
Dashboard Settings
Show Dashboard [Default: Enabled]
- Toggles the information panel display
Dashboard Position [Default: Top Right]
- Choose from 6 positions on the chart
Background Color [Default: Black 90% opacity]
- Dashboard background color
Text Color [Default: White]
- Dashboard text color
Text Size [Default: Tiny]
- Dashboard text size (tiny/small/normal/large)
Tips for Effective Use
- Start with default settings and adjust based on your trading style and timeframe
- Use multiple timeframes to identify confluence between zones on different scales
- Combine with other indicators like trend analysis or momentum oscillators
- Pay attention to clusters as they represent stronger liquidity areas
- Monitor volume-confirmed zones for higher probability setups
- Adjust zone duration based on your trading timeframe (shorter for scalping, longer for swing trading)
- Use the debug feature if zones aren't appearing to understand why
- Keep the chart clean by limiting the number of visible zones
Common Issues and Solutions
No zones appearing:
- Lower the Swing Strength setting
- Switch to Combined detection method
- Disable volume filter if active
- Check if there's enough historical data
Too many zones:
- Increase Swing Strength
- Enable volume filter
- Reduce Max Number of Visible Zones
- Increase Cluster Threshold
Zones disappearing too quickly:
- Increase Max Zone Duration
- Check if zones are being broken by price
Poor performance on higher timeframes:
- Enable Auto-Adjust for Timeframe
- Use appropriate Swing Strength for the timeframe
- Consider using Classic method instead of Fractal
受保護腳本
此腳本以閉源形式發佈。 不過,您可以自由使用,沒有任何限制 — 點擊此處了解更多。
免責聲明
這些資訊和出版物並非旨在提供,也不構成TradingView提供或認可的任何形式的財務、投資、交易或其他類型的建議或推薦。請閱讀使用條款以了解更多資訊。
受保護腳本
此腳本以閉源形式發佈。 不過,您可以自由使用,沒有任何限制 — 點擊此處了解更多。
免責聲明
這些資訊和出版物並非旨在提供,也不構成TradingView提供或認可的任何形式的財務、投資、交易或其他類型的建議或推薦。請閱讀使用條款以了解更多資訊。