OPEN-SOURCE SCRIPT
Fed Net Liquidity
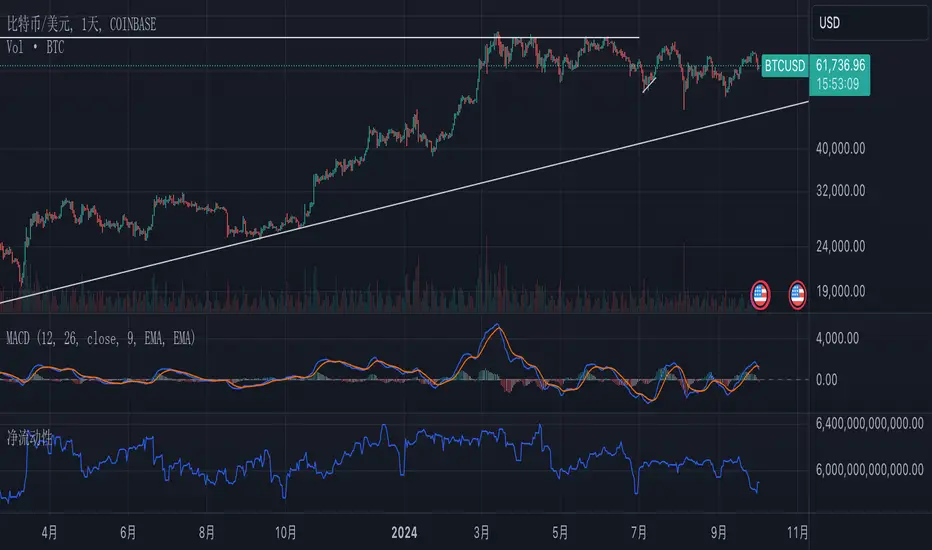
Net Liquidity = Federal Reserve Total Assets - Treasury General Account (TGA) - Reverse Repurchase Agreements (RRP) Balance
1. Federal Reserve Total Assets: This is the sum of everything the Fed owns, like government bonds and mortgage-backed securities. You can snag this data from the Fed’s weekly balance sheet report.
2. Treasury General Account (TGA): Think of this as the U.S. government’s checking account at the Fed. When the TGA balance goes up, it means the government is pulling liquidity out of the market, and vice versa.
3. Reverse Repurchase Agreements (RRP) Balance: This represents the liquidity the Fed absorbs from the market through reverse repo operations. When financial institutions park money in the Fed’s RRP account, there’s less cash available in the market.
Why Use Net Liquidity?
Net liquidity is seen as a key indicator of the actual amount of money available in the market. It helps gauge the overall liquidity conditions that can influence financial markets.
Where to Find the Data:
1. Federal Reserve Total Assets: You can find this in the Fed’s weekly balance sheet (the H.4.1 report). Here’s the link: Federal Reserve Statistical Release - H.4.1.
Steps to Calculate Net Liquidity Yourself:
1. Get the Fed’s Total Assets: Look up the latest H.4.1 report and jot down the total assets figure.
2. Find the TGA Balance: Head over to the U.S. Treasury’s Daily Treasury Statement to locate the “Treasury General Account” balance.
3. Get the RRP Balance: You can find this number in the H.4.1 report or on the New York Fed’s website under “Reverse Repurchase Agreements.”
4. Do the Math: Simply subtract the TGA and RRP balances from the Fed’s total assets—that gives you the net liquidity.
開源腳本
秉持TradingView一貫精神,這個腳本的創作者將其設為開源,以便交易者檢視並驗證其功能。向作者致敬!您可以免費使用此腳本,但請注意,重新發佈代碼需遵守我們的社群規範。
免責聲明
這些資訊和出版物並非旨在提供,也不構成TradingView提供或認可的任何形式的財務、投資、交易或其他類型的建議或推薦。請閱讀使用條款以了解更多資訊。
免責聲明
這些資訊和出版物並非旨在提供,也不構成TradingView提供或認可的任何形式的財務、投資、交易或其他類型的建議或推薦。請閱讀使用條款以了解更多資訊。