OPEN-SOURCE SCRIPT
Finnie's HL BREAKOUT
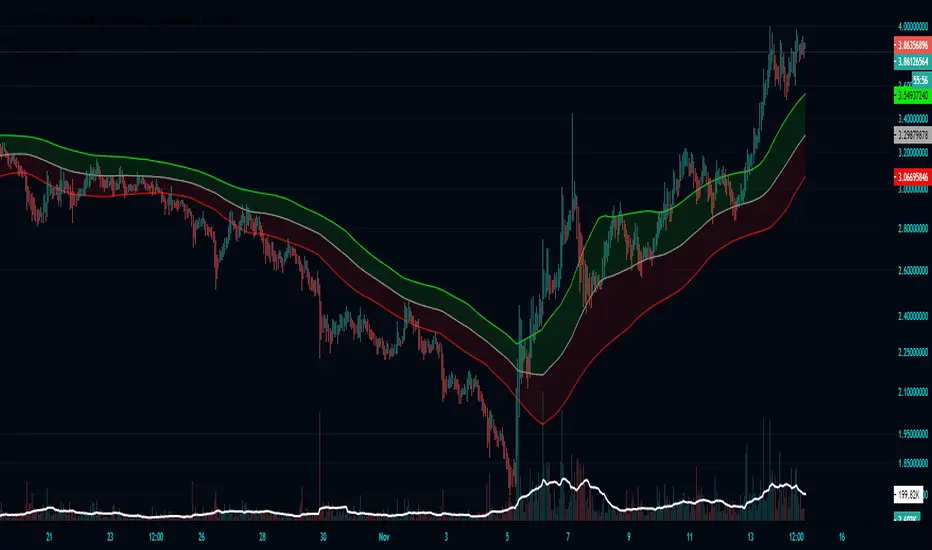
First the indicators takes a range, by default it is 22 candles, then finds the highest and lowest points of said range. At this point your left with lines that follow your support and resistance in the given range (take a look by change the 100 ema in settings to 1). To take things a step further I took a 100 candle ema of the highest highest and lowest lows to not only smooth things out, but also to provide visual ques for breakouts, when closing price is above the top band the asset is considered to be breaking out.
開源腳本
秉持TradingView一貫精神,這個腳本的創作者將其設為開源,以便交易者檢視並驗證其功能。向作者致敬!您可以免費使用此腳本,但請注意,重新發佈代碼需遵守我們的社群規範。
免責聲明
這些資訊和出版物並非旨在提供,也不構成TradingView提供或認可的任何形式的財務、投資、交易或其他類型的建議或推薦。請閱讀使用條款以了解更多資訊。
開源腳本
秉持TradingView一貫精神,這個腳本的創作者將其設為開源,以便交易者檢視並驗證其功能。向作者致敬!您可以免費使用此腳本,但請注意,重新發佈代碼需遵守我們的社群規範。
免責聲明
這些資訊和出版物並非旨在提供,也不構成TradingView提供或認可的任何形式的財務、投資、交易或其他類型的建議或推薦。請閱讀使用條款以了解更多資訊。