OPEN-SOURCE SCRIPT
TDI w/ Variety RSI, Averages, & Source Types [Loxx]
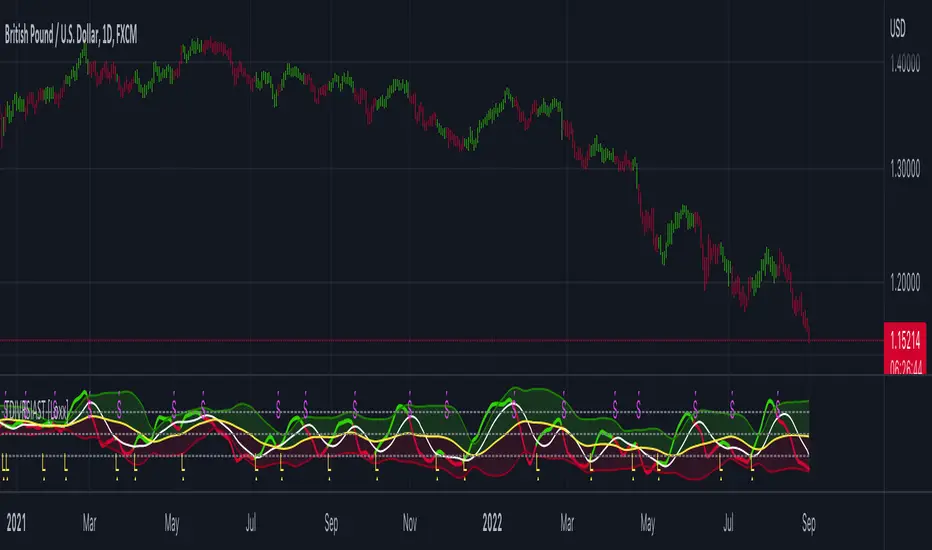
This hybrid indicator is developed to assist traders in their ability to decipher and monitor market conditions related to trend direction, market strength, and market volatility. Even though comprehensive, the Traders Dynamic Index (TDI) is easy to read and use. This version of TDI has 7 different types of RSI, 38 different types of Moving Averages, 33 source types, and 5 types of signals as well as alerts and coloring. Default RSI type is set to Jurik's RSX. This indicator can be used on any timeframe.
Green/Red line = RSI Price line
White line = Trade Signal line
Dark Green/Red lines = Volatility Band
Yellow line = Market Base Line
Gray dashed lines = Horizontal boundary lines, oversold/overbought
5 Signal Types w/ Alerts
Signal Crosses = Green/Red line crosses over or under White line
Floating Boundary Crosses = Green/Red line crosses over or under upper Dark Green/ lower Red lines
Horizontal Boundary Crosses = Green/Red line crosses over or under Gray dashed upper/lower lines
Floating Middle Crosses = Green/Red line crosses over or under Yellow line
Horizontal Middle Crosses = Green/Red line crosses over or under Gray dashed middle line
Manual Signal Types (no alerts included, this requires manual analysis)
Volatility Band Signals (Dark Green/Red lines) = When the Dark Green/Red lines are expanding, the market is strong and trending. When Dark Green/Red lines are constricting, the market is weak and in a range. When the Dark Green/Red lines are extremely tight in a narrow range, expect an economic announcement or other market condition to spike the market
Beyond these simple signal rules, there are various other signals or methods that can be used to derive long/short/exit signals from TDI included slope of the Green/Red line and bounces off the Yellow line.
Included
- Loxx's Expanded Source Types
- Loxx's Variety RSI
- Loxx's Moving Averages
- Signals
- Alerts
- Bar coloring
開源腳本
秉持TradingView一貫精神,這個腳本的創作者將其設為開源,以便交易者檢視並驗證其功能。向作者致敬!您可以免費使用此腳本,但請注意,重新發佈代碼需遵守我們的社群規範。
Public Telegram Group, t.me/algxtrading_public
VIP Membership Info: patreon.com/algxtrading/membership
VIP Membership Info: patreon.com/algxtrading/membership
免責聲明
這些資訊和出版物並非旨在提供,也不構成TradingView提供或認可的任何形式的財務、投資、交易或其他類型的建議或推薦。請閱讀使用條款以了解更多資訊。