OPEN-SOURCE SCRIPT
Standard deviation channel of linear regression distance [AbAh]
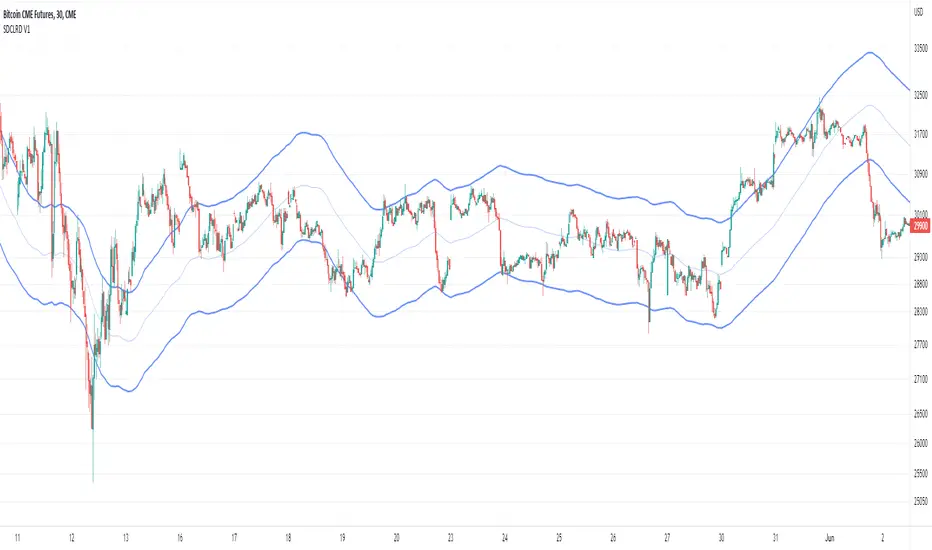
The indicator calculates the distance between linear regression line and the data point (price) as a percentage , then calculates the standard deviation for the linear regression distance , then draw the channel of two lines depending on the values of standard deviation .
///////// How to use ////////////////
1 - for Best result , indicator should be used on 2H frame Time of less : like 1H or 30 min
2 - The upper line and the lower line, both play a role as a support and resistance area, when the price bounces from the upper zone or lower zone, there is a high probability that it will move to the other line.
3 - The price breakout of one of the lower or upper lines may indicate a major price movement coming in the direction of the breakout
/////////////////////////////////////
開源腳本
秉持TradingView一貫精神,這個腳本的創作者將其設為開源,以便交易者檢視並驗證其功能。向作者致敬!您可以免費使用此腳本,但請注意,重新發佈代碼需遵守我們的社群規範。
免責聲明
這些資訊和出版物並非旨在提供,也不構成TradingView提供或認可的任何形式的財務、投資、交易或其他類型的建議或推薦。請閱讀使用條款以了解更多資訊。
開源腳本
秉持TradingView一貫精神,這個腳本的創作者將其設為開源,以便交易者檢視並驗證其功能。向作者致敬!您可以免費使用此腳本,但請注意,重新發佈代碼需遵守我們的社群規範。
免責聲明
這些資訊和出版物並非旨在提供,也不構成TradingView提供或認可的任何形式的財務、投資、交易或其他類型的建議或推薦。請閱讀使用條款以了解更多資訊。