INVITE-ONLY SCRIPT
已更新 TradeChartist Catalyst
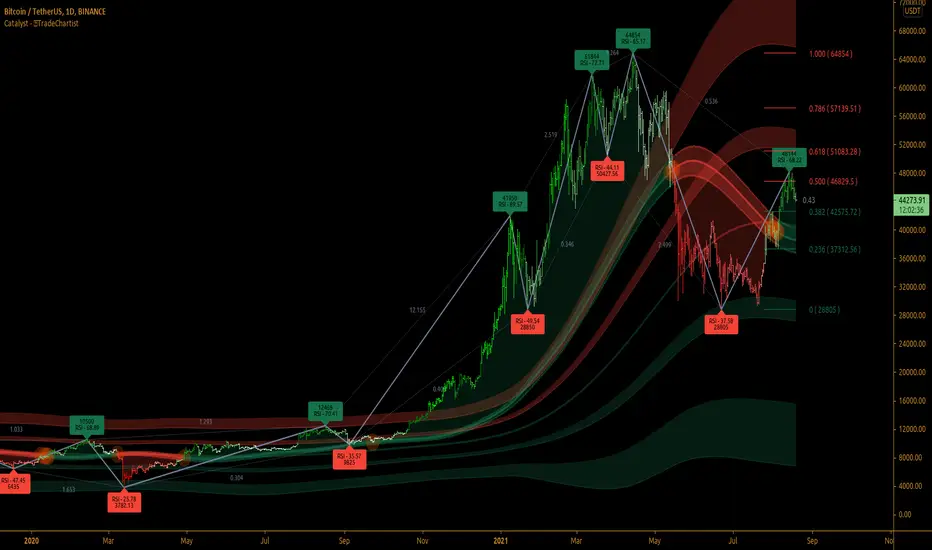
™TradeChartist Catalyst is an elegant script that combines Catalyst Trade Bands and automatic ZigZag/Fibonacci plots using an original logic to help users interact in a visually engaging and meaningful way with the charts.
===================================================================================================================
™TradeChartist Catalyst features
=============================
1. Catalyst Trade Bands
Catalyst Trade Bands comprises Equilibrium or Mean Bands, Inner Bands, Outer Bands and a Overall Mean Line. Catalyst Trade Bands help visualize the price action in relation to the Equilibrium Bands and clearly show how far away from the mean the current price is. The Trade Bands are of two types - Normal and Weighted. Weighted Bands are very sensitive to price action and a higher Bands length is recommended.
Simple 144 vs Weighted 144 Trade Bands

2. Equilibrium Touch Points
Every time the price touches the Equilibrium, an orange touch point appears on the chart. Normally, the Equilibrium line, for an optimal sample, acts as support or resistance. Price breaching or failing this line usually signals a Pull Back, a Throw Back or a Trend Change based on how the price interacts with it. This can be used with a secondary confirmation like RSI, Stochastic etc. For example, if the price falls back significantly only to touch the Equilibrium Line and fails to test the Overall Mean Line when Stochastic is below 30, this could mean a strong Pull Back rather than a Trend Change as shown in the example chart below.

When price fails the Equilibrium Bands, the fill colour of the Equilibrium bands changes to Bearish colour. If the Overall Mean line is below the Equilibrium bands and is in a reasonable distance, Mean will act as support as shown in the example below. Price failing the mean will test Inner Bands and strong bear momentum could take price to Outer Bands and beyond.

All the components of the Catalyst Trade Bands including the Touch Points can be enabled or disabled from the settings.
3. ZigZag & Fibonacci
Catalyst automatically plots ZigZag and Auto Fibonacci Retracement based on an intelligent logic and can be tweaked by changing the Zigzag & Auto-Fibs Factor from the settings. It also plots Fib ratios and connectors along with price highs and lows of ZigZag. The ratios can be especially useful to visually detect harmonic patterns and also serves as a useful feature for Fibonacci traders.

4. Fibonacci Customisation
Catalyst users can customise Fibonacci type and levels, including levels colour from Catalyst settings. In addition to Auto-Fibs, users can also plot Fibonacci levels based on Days or Candles lookback. This is a very useful feature if the user wants to override Auto-Fibs to suit his/her needs. Users can also reverse the Fibonacci Levels by enabling Reverse from settings.
In the following example chart of
 USDCAD, Fibonacci levels based on 10 days lookback is plotted.

===================================================================================================================
Best Practice: Test with different settings first using Paper Trades before trading with real money
===================================================================================================================
===================================================================================================================
™TradeChartist Catalyst features
=============================
1. Catalyst Trade Bands
Catalyst Trade Bands comprises Equilibrium or Mean Bands, Inner Bands, Outer Bands and a Overall Mean Line. Catalyst Trade Bands help visualize the price action in relation to the Equilibrium Bands and clearly show how far away from the mean the current price is. The Trade Bands are of two types - Normal and Weighted. Weighted Bands are very sensitive to price action and a higher Bands length is recommended.
Simple 144 vs Weighted 144 Trade Bands
2. Equilibrium Touch Points
Every time the price touches the Equilibrium, an orange touch point appears on the chart. Normally, the Equilibrium line, for an optimal sample, acts as support or resistance. Price breaching or failing this line usually signals a Pull Back, a Throw Back or a Trend Change based on how the price interacts with it. This can be used with a secondary confirmation like RSI, Stochastic etc. For example, if the price falls back significantly only to touch the Equilibrium Line and fails to test the Overall Mean Line when Stochastic is below 30, this could mean a strong Pull Back rather than a Trend Change as shown in the example chart below.
When price fails the Equilibrium Bands, the fill colour of the Equilibrium bands changes to Bearish colour. If the Overall Mean line is below the Equilibrium bands and is in a reasonable distance, Mean will act as support as shown in the example below. Price failing the mean will test Inner Bands and strong bear momentum could take price to Outer Bands and beyond.
All the components of the Catalyst Trade Bands including the Touch Points can be enabled or disabled from the settings.
3. ZigZag & Fibonacci
Catalyst automatically plots ZigZag and Auto Fibonacci Retracement based on an intelligent logic and can be tweaked by changing the Zigzag & Auto-Fibs Factor from the settings. It also plots Fib ratios and connectors along with price highs and lows of ZigZag. The ratios can be especially useful to visually detect harmonic patterns and also serves as a useful feature for Fibonacci traders.
4. Fibonacci Customisation
Catalyst users can customise Fibonacci type and levels, including levels colour from Catalyst settings. In addition to Auto-Fibs, users can also plot Fibonacci levels based on Days or Candles lookback. This is a very useful feature if the user wants to override Auto-Fibs to suit his/her needs. Users can also reverse the Fibonacci Levels by enabling Reverse from settings.
In the following example chart of
===================================================================================================================
Best Practice: Test with different settings first using Paper Trades before trading with real money
===================================================================================================================
發行說明
Code Optimised/updated- Added option to show RSI at ZigZag Highs and Lows.
- Mean Touchpoint to show even when price doesn't touch Mean during Gap up/Gap down.
發行說明
Added - Tooltip that shows the current RSI at current price fib label發行說明
Code optimised僅限邀請腳本
只有經作者授權的使用者才能訪問此腳本,且通常需付費。您可以將此腳本加入收藏,但需先向作者申請並獲得許可後才能使用 — 點擊此處了解更多。如需更多詳情,請依照作者說明或直接聯繫TradeChartist。
除非您完全信任其作者並了解腳本的工作原理,否則TradingView不建議您付費或使用腳本。您也可以在我們的社群腳本中找到免費的開源替代方案。
作者的說明
Get in touch with me via Private Message to request trial access to the invite-only scripts and for more information.
提醒:在請求訪問權限之前,請閱讀僅限邀請腳本指南。
Get in touch with me if you would like access to my Premium scripts for a trial before deciding on lifetime access.
Telegram - @Trade_Chartist
Free Scripts - bit.ly/Free-Scripts
Telegram - @Trade_Chartist
Free Scripts - bit.ly/Free-Scripts
免責聲明
這些資訊和出版物並不意味著也不構成TradingView提供或認可的金融、投資、交易或其他類型的意見或建議。請在使用條款閱讀更多資訊。
僅限邀請腳本
只有經作者授權的使用者才能訪問此腳本,且通常需付費。您可以將此腳本加入收藏,但需先向作者申請並獲得許可後才能使用 — 點擊此處了解更多。如需更多詳情,請依照作者說明或直接聯繫TradeChartist。
除非您完全信任其作者並了解腳本的工作原理,否則TradingView不建議您付費或使用腳本。您也可以在我們的社群腳本中找到免費的開源替代方案。
作者的說明
Get in touch with me via Private Message to request trial access to the invite-only scripts and for more information.
提醒:在請求訪問權限之前,請閱讀僅限邀請腳本指南。
Get in touch with me if you would like access to my Premium scripts for a trial before deciding on lifetime access.
Telegram - @Trade_Chartist
Free Scripts - bit.ly/Free-Scripts
Telegram - @Trade_Chartist
Free Scripts - bit.ly/Free-Scripts
免責聲明
這些資訊和出版物並不意味著也不構成TradingView提供或認可的金融、投資、交易或其他類型的意見或建議。請在使用條款閱讀更多資訊。