OPEN-SOURCE SCRIPT
Kalman Trend Levels [BigBeluga]
Kalman Trend Levels is an advanced trend-following indicator designed to highlight key support and resistance zones based on Kalman filter crossovers. With dynamic trend analysis and actionable signals, it helps traders interpret market direction and momentum shifts effectively.
🔵 Key Features:
🔵When to Use:
The Kalman Trend Levels indicator is ideal for traders looking to identify and act upon trend changes and significant price zones. By visualizing key levels and momentum shifts, this tool allows you to:
With its focus on trend direction, support/resistance, and momentum clarity, Kalman Trend Levels is an essential tool for navigating trending markets, providing actionable insights with every crossover and trend shift.
🔵 Key Features:
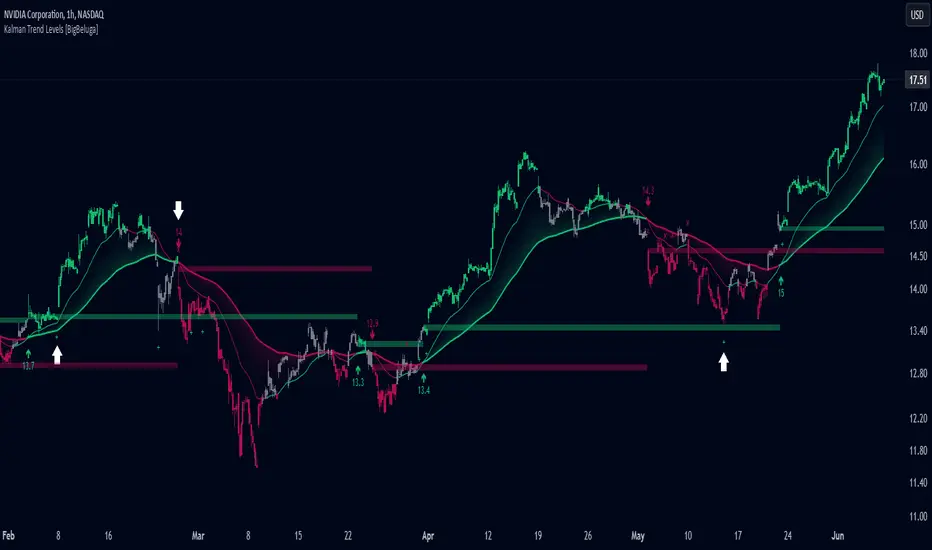
- Trend Levels with Crossover Boxes: Identifies trend shifts by tracking crossovers between fast and slow Kalman filters. When the fast line crosses above the slow line, a green box level appears, indicating a potential support zone. When it crosses below, a red box level forms, acting as a resistance zone.
- Retest Signals for Support and Resistance Levels: Enable retest signals to capture price rejections at the established levels, providing possible re-entry points where the price confirms a support or resistance area.
- Adaptive Candle Coloring by Trend Momentum: Candle colors adjust based on the trend's strength:
> During a downtrend, if the fast Kalman line shows upward movement, indicating reduced bearish momentum, candles turn gray to signal the weakening trend.
> In an uptrend, when the fast Kalman line declines, showing lower bullish momentum, candles become gray, signaling a potential slowdown in upward movement. - Crossover Signals with Price Labels: Displays arrows with price values at crossover points for quick reference, marking where the fast line overtakes or dips below the slow line. These labels provide a precise price snapshot of significant trend changes.
🔵When to Use:
The Kalman Trend Levels indicator is ideal for traders looking to identify and act upon trend changes and significant price zones. By visualizing key levels and momentum shifts, this tool allows you to:
- Define support and resistance zones that align with trend direction.
- Identify and react to trend weakening or strengthening via candle color changes.
- Use retest signals for potential re-entries at critical levels.
- See crossover points and price values to gain a clearer view of trend changes in real time.
With its focus on trend direction, support/resistance, and momentum clarity, Kalman Trend Levels is an essential tool for navigating trending markets, providing actionable insights with every crossover and trend shift.
開源腳本
秉持TradingView一貫精神,這個腳本的創作者將其設為開源,以便交易者檢視並驗證其功能。向作者致敬!您可以免費使用此腳本,但請注意,重新發佈代碼需遵守我們的社群規範。
🔵Gain access to our powerful tools : bigbeluga.com/tv
🔵Join our free discord for updates : bigbeluga.com/discord
All scripts & content provided by BigBeluga are for informational & educational purposes only.
🔵Join our free discord for updates : bigbeluga.com/discord
All scripts & content provided by BigBeluga are for informational & educational purposes only.
免責聲明
這些資訊和出版物並非旨在提供,也不構成TradingView提供或認可的任何形式的財務、投資、交易或其他類型的建議或推薦。請閱讀使用條款以了解更多資訊。