OPEN-SOURCE SCRIPT
Dual EMA Trend Ribbon (Multi-Timeframe Trend Confirmation)
Dual EMA Trend Ribbon (Multi-Timeframe Trend Confirmation)
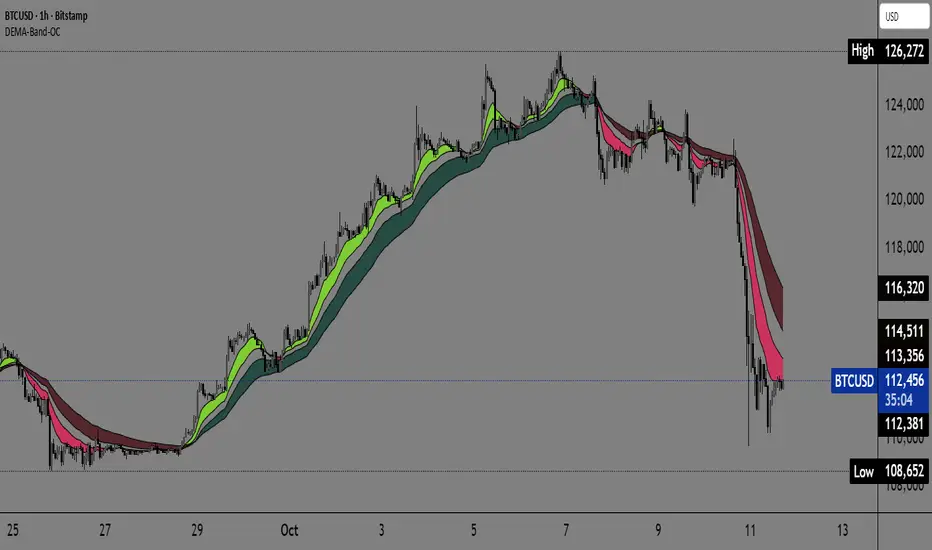
This Pine Script indicator creates a visually clear representation of trend direction using two overlaid Exponential Moving Average (EMA) Ribbons, which allows traders to assess both short-term and medium-term momentum at a glance.
How It Works:
The indicator plots two separate EMA ribbons, each calculated using a distinct set of periods, simulating a multi-timeframe approach on a single chart:
Inner (Fast) Ribbon (Defaults 10/30): Represents the fast-moving, short-term trend.
Green: Fast EMA 1 > Slow EMA 1 (Short-term Bullish)
Red: Fast EMA 1 < Slow EMA 1 (Short-term Bearish)
Outer (Slow) Ribbon (Defaults 40/50): Represents the slower, medium-term trend.
Darker Green/Red: Indicates the overall, underlying market bias.
How to Use:
Strong Trend Confirmation: A strong signal occurs when both ribbons are aligned (e.g., both are Green). This suggests that short-term momentum aligns with the medium-term bias.
Trend Weakness/Reversal: Pay attention when the two ribbons cross or when the fast ribbon changes color against the slow ribbon's color (e.g., fast ribbon turns Red while the slow ribbon remains Green). This often signals a temporary pullback or potential reversal of the underlying trend.
Settings: Users can easily adjust the four input periods (Fast EMA 1, Slow EMA 1, Fast EMA 2, Slow EMA 2) to customize the sensitivity to any trading style or asset.
開源腳本
秉持TradingView一貫精神,這個腳本的創作者將其設為開源,以便交易者檢視並驗證其功能。向作者致敬!您可以免費使用此腳本,但請注意,重新發佈代碼需遵守我們的社群規範。
Free telegram channel t.me/alexmasterforex
免責聲明
這些資訊和出版物並非旨在提供,也不構成TradingView提供或認可的任何形式的財務、投資、交易或其他類型的建議或推薦。請閱讀使用條款以了解更多資訊。
開源腳本
秉持TradingView一貫精神,這個腳本的創作者將其設為開源,以便交易者檢視並驗證其功能。向作者致敬!您可以免費使用此腳本,但請注意,重新發佈代碼需遵守我們的社群規範。
Free telegram channel t.me/alexmasterforex
免責聲明
這些資訊和出版物並非旨在提供,也不構成TradingView提供或認可的任何形式的財務、投資、交易或其他類型的建議或推薦。請閱讀使用條款以了解更多資訊。