OPEN-SOURCE SCRIPT
Smooth RSI [MarktQuant]
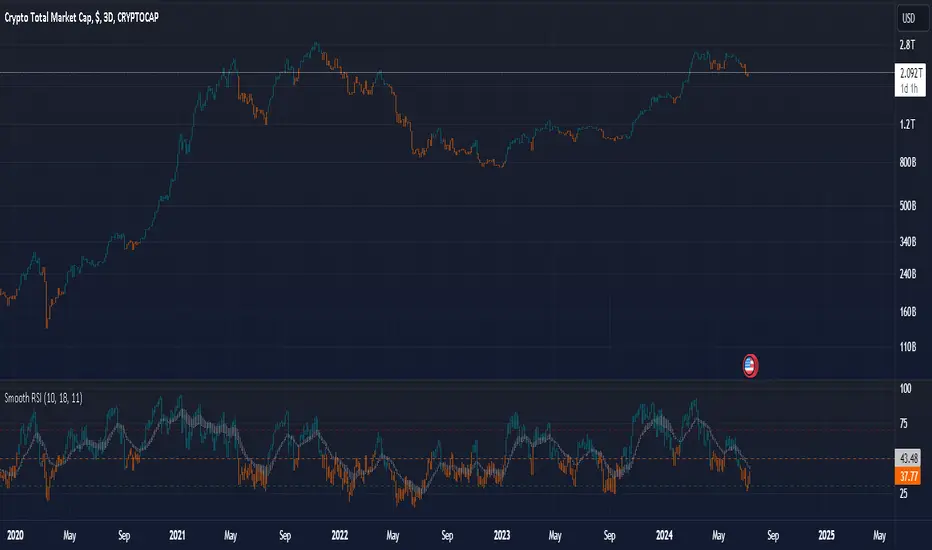
This Smooth RSI offers a nuanced analysis of the Relative Strength Index (RSI) by smoothing it through multiple averaging techniques. It provides additional insights into market movements and potential trading signals.
Key Features:
1. RSI Calculation:
- Calculates the RSI for high, open, low, and close prices over a user-defined period.
- Averages these four RSI values to derive a smoothed RSI.
2. Exponential Moving Average (EMA) of RSI:
- Applies an EMA to each of the four RSI values over a user-defined period.
- Averages these EMA values to produce a smoothed EMA of RSI.
3. Rate of Change (RoC) Calculation:
- Computes the Rate of Change for high, open, low, and close prices over a user-defined period (`lengthc`).
- Averages these four RoC values to generate a smoothed RoC (`sumc`).
- Colors the RoC bars based on their value: positive (green) or negative (red).
4. Trend Indication:
- Identifies long signals when the smoothed RSI is above 50.
- Identifies short signals when the smoothed RSI is below 50.
- Highlights bullish conditions when both long signals and positive RoC are present.
- Highlights bearish conditions when both short signals and negative RoC are present.
5. Visual Elements:
- Bar colors change to teal for bullish conditions and orange for bearish conditions.
- Horizontal lines at 30, 50, and 70 mark key RSI levels.
- Candlestick plots of the smoothed RSI, EMA of RSI, and RoC.
6. Customization Options:
- Toggle visibility of RSI, EMA of RSI, and RoC candlestick plots through input settings in the "Plot Settings" group.
Usage:
- This indicator can be used to smooth out the traditional RSI signals, providing a clearer view of the market's momentum.
- The EMA and RoC components add additional layers of analysis, helping traders confirm trends and potential reversals.
- The color-coded bars and plot lines visually highlight critical levels and conditions, making it easier to interpret the market's behavior at a glance.
This "Smooth RSI" indicator is an advanced tool designed to enhance your technical analysis, offering a refined approach to understanding price momentum and trend strength.
開源腳本
秉持TradingView一貫精神,這個腳本的創作者將其設為開源,以便交易者檢視並驗證其功能。向作者致敬!您可以免費使用此腳本,但請注意,重新發佈代碼需遵守我們的社群規範。
🔍 Access Investing Strategies & Indicators
📊 whop.com/marktquant
🌐 marktquant.com
Nothing shared on this page constitutes financial advice. All information, tools, and analyses are provided solely for informational and educational purposes.
📊 whop.com/marktquant
🌐 marktquant.com
Nothing shared on this page constitutes financial advice. All information, tools, and analyses are provided solely for informational and educational purposes.
免責聲明
這些資訊和出版物並非旨在提供,也不構成TradingView提供或認可的任何形式的財務、投資、交易或其他類型的建議或推薦。請閱讀使用條款以了解更多資訊。