INVITE-ONLY SCRIPT
已更新 Flux Charts - S&D Screener
💎 GENERAL OVERVIEW
Introducing Supply & Demand Zones (S&D) Screener! This screener can spot trading opportunities for Supply & Demand traders across 8 different tickers and timeframes simultaneously! This screener offers a wide range of configurable settings, explained within this write-up.

S&D Screener Features:
🚩UNIQUENESS
The S&D Screener is the first ever tool on TradingView that allows traders to screen 8 different tickers on different timeframes for Supply & Demand Zones. Key factors that make it unique include:
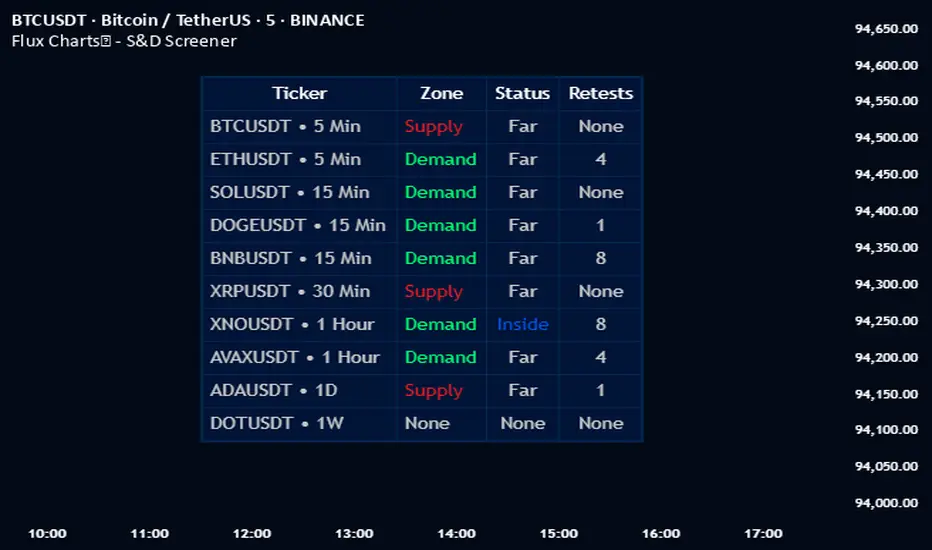
✅ Comprehensive Dashboard – This screener provides a complete and customizable dashboard designed to enhance traders' decision-making by consolidating crucial Supply & Demand insights into one user-friendly interface.
✅ Multi-Ticker & Multi-Timeframe Analysis – With support for up to 8 tickers and timeframes, traders can effortlessly analyze the bigger market picture, identifying trends and opportunities across different assets and timeframes.
By combining multiple analytical elements in a single view, this screener empowers traders with the insights needed to navigate the market more effectively.

📌HOW DOES IT WORK ?
The S&D Screener helps traders identify Supply & Demand Zones on multiple tickers & timeframes. It offers customizable settings to adapt to different trading styles. The screener includes two zone detection methods. The Momentum Method identifies zones based on strong bullish or bearish price movements, making it ideal for traders who seek quick market reactions. The Regression Method uses statistical regression to detect zones by analyzing price deviations from the trend, which is more suitable for long-term traders. You can customize your zone preferences and enable up to 8 tickers and their respective timeframes. You'll be able to see the status of the latest detected zones on that ticker/timeframe. You can also see the distance from current price of the ticker to the zone and how many times price has retested that zone.
Supply Zone
In trading, a supply zone is a specific area on a price chart where selling interest surpasses buying interest, leading to a potential decline in asset prices. This zone typically forms after a price rally, indicating that sellers find the asset overvalued and are prepared to sell, creating downward pressure. Identifying supply zones can help traders anticipate potential price reversals or pullbacks.
Trading Possibilities with Supply Zones
Entering Short Positions -> When the price approaches a recognized supply zone, traders may consider initiating short positions, anticipating that increased selling pressure will drive prices down.
Setting Profit Targets -> For traders holding long positions, supply zones can serve as strategic points to set profit targets, as these areas may signal potential resistance and a subsequent price drop.
Demand Zone
In trading, a demand zone is a specific area on a price chart where buying interest is strong enough to halt a downtrend and potentially reverse it upward. This zone indicates a price level where demand exceeds supply, leading to a rise in price. Identifying these zones can provide traders with strategic entry points for potential long positions.
Trading Possibilities with Demand Zones
Entering Long Positions -> When the price approaches a recognized demand zone, traders may consider initiating long positions, anticipating that increased buying pressure will drive prices up.
Setting Profit Targets -> For traders holding short positions, demand zones can serve as strategic points to set profit targets, as these areas may signal potential resistance and a subsequent price increase.
Momentum Detection Method
The Momentum Detection Method identifies supply and demand zones by analyzing the strength and direction of price movements over a specified period. It looks for a sequence of strong bullish or bearish candles to determine potential zones. The method is sensitive to the ‘Sensitivity’ setting, which adjusts the threshold for what constitutes a "strong" candle.
Using the momentum method is ideal for traders looking to capitalize on immediate price reactions and momentum shifts.
Regression Detection Method
The Regression Method uses statistical regression to identify supply and demand zones by analyzing price consolidation patterns. It fits a regression line to price data and identifies zones where price deviates significantly from the trend. This method is more mathematical and less reliant on individual candle patterns. It focuses on the overall price structure and identifies zones based on statistical deviations from the trend.
This method is particularly useful for traders who focus on longer-term price trends and prefer a more statistical approach to pinpoint zones.
Using the momentum method is ideal for traders looking to capitalize on immediate price reactions and momentum shifts.
Status ->
Retests -> A retest occurs when the price revisits a supply or demand zone but fails to break through it. Specifically, during a retest, the wick of a candlestick enters the zone, but the candle closes below the supply zone or above the demand zone. This price action suggests that the zone remains a strong area of resistance or support, as the market couldn't sustain movement beyond it. Traders often view such retests as confirmations to enter positions in the direction opposite to the zone's boundary. For instance, if the price retests a supply zone and fails to close above it, it may signal a selling opportunity. Conversely, a failed retest of a demand zone could indicate a buying opportunity. Monitoring the number of retests can provide insights into the strength of these zones; multiple retests without a breakout may reinforce the zone's significance. Here you can see how many times the price retested the supply or demand zone.
⚠ Timeframe Restriction: The selected timeframes for analysis cannot be lower than the chart’s current timeframe to ensure proper data alignment.
⏰ALERTS
This screener supports alerts, so you never miss a key market move. You can choose to receive alerts when a new demand or supply zone is created, helping you spot potential trading opportunities. Additionally, you can enable alerts for retests, which notify you when the price returns to test a previously identified zone. The alerts will work for each enabled ticker in the settings.
⚙️SETTINGS
1. General Configuration
2. Tickers
You can set, then enable or disable up to 8 tickers in this section to get informed about their latest supply or demand zone.
Introducing Supply & Demand Zones (S&D) Screener! This screener can spot trading opportunities for Supply & Demand traders across 8 different tickers and timeframes simultaneously! This screener offers a wide range of configurable settings, explained within this write-up.
S&D Screener Features:
- Supply & Demand Zones: This tool can detect Supply & Demand zones using one of the two detection methods.
- Highly Configurable: Offers multiple parameters for fine-tuning detection settings.
- Up to 8 Tickers: Allows traders to analyze multiple tickers & timeframes simultaneously for enhanced accuracy.
🚩UNIQUENESS
The S&D Screener is the first ever tool on TradingView that allows traders to screen 8 different tickers on different timeframes for Supply & Demand Zones. Key factors that make it unique include:
✅ Comprehensive Dashboard – This screener provides a complete and customizable dashboard designed to enhance traders' decision-making by consolidating crucial Supply & Demand insights into one user-friendly interface.
✅ Multi-Ticker & Multi-Timeframe Analysis – With support for up to 8 tickers and timeframes, traders can effortlessly analyze the bigger market picture, identifying trends and opportunities across different assets and timeframes.
By combining multiple analytical elements in a single view, this screener empowers traders with the insights needed to navigate the market more effectively.
📌HOW DOES IT WORK ?
The S&D Screener helps traders identify Supply & Demand Zones on multiple tickers & timeframes. It offers customizable settings to adapt to different trading styles. The screener includes two zone detection methods. The Momentum Method identifies zones based on strong bullish or bearish price movements, making it ideal for traders who seek quick market reactions. The Regression Method uses statistical regression to detect zones by analyzing price deviations from the trend, which is more suitable for long-term traders. You can customize your zone preferences and enable up to 8 tickers and their respective timeframes. You'll be able to see the status of the latest detected zones on that ticker/timeframe. You can also see the distance from current price of the ticker to the zone and how many times price has retested that zone.
Supply Zone
In trading, a supply zone is a specific area on a price chart where selling interest surpasses buying interest, leading to a potential decline in asset prices. This zone typically forms after a price rally, indicating that sellers find the asset overvalued and are prepared to sell, creating downward pressure. Identifying supply zones can help traders anticipate potential price reversals or pullbacks.
Trading Possibilities with Supply Zones
Entering Short Positions -> When the price approaches a recognized supply zone, traders may consider initiating short positions, anticipating that increased selling pressure will drive prices down.
Setting Profit Targets -> For traders holding long positions, supply zones can serve as strategic points to set profit targets, as these areas may signal potential resistance and a subsequent price drop.
Demand Zone
In trading, a demand zone is a specific area on a price chart where buying interest is strong enough to halt a downtrend and potentially reverse it upward. This zone indicates a price level where demand exceeds supply, leading to a rise in price. Identifying these zones can provide traders with strategic entry points for potential long positions.
Trading Possibilities with Demand Zones
Entering Long Positions -> When the price approaches a recognized demand zone, traders may consider initiating long positions, anticipating that increased buying pressure will drive prices up.
Setting Profit Targets -> For traders holding short positions, demand zones can serve as strategic points to set profit targets, as these areas may signal potential resistance and a subsequent price increase.
Momentum Detection Method
The Momentum Detection Method identifies supply and demand zones by analyzing the strength and direction of price movements over a specified period. It looks for a sequence of strong bullish or bearish candles to determine potential zones. The method is sensitive to the ‘Sensitivity’ setting, which adjusts the threshold for what constitutes a "strong" candle.
Using the momentum method is ideal for traders looking to capitalize on immediate price reactions and momentum shifts.
Regression Detection Method
The Regression Method uses statistical regression to identify supply and demand zones by analyzing price consolidation patterns. It fits a regression line to price data and identifies zones where price deviates significantly from the trend. This method is more mathematical and less reliant on individual candle patterns. It focuses on the overall price structure and identifies zones based on statistical deviations from the trend.
This method is particularly useful for traders who focus on longer-term price trends and prefer a more statistical approach to pinpoint zones.
Using the momentum method is ideal for traders looking to capitalize on immediate price reactions and momentum shifts.
Status ->
- Far -> This status indicates that the current price is significantly distant from any identified supply or demand zones. In this scenario, traders might exercise patience, waiting for the price to approach these zones before considering entry or exit points.
- Approaching ⬆️ -> The price is rising towards a supply zone, suggesting potential selling opportunities as the price nears an area where selling pressure previously dominated.
- Approaching ⬇️ -> The price is falling towards a demand zone, indicating potential buying opportunities as the price approaches an area known for strong buying interest.
- Inside -> The current price is within the boundaries of a supply or demand zone. This status often signals a critical decision point:
Inside a Supply Zone: The area where selling pressure may increase, potentially leading to a price decline. Traders might look for confirmation before initiating short positions.
Inside a Demand Zone: The area where buying interest could surge, possibly resulting in a price increase. Traders might seek validation before entering long positions.
Being "inside" a zone suggests heightened market activity and potential volatility, warranting close monitoring for trading signals.
Retests -> A retest occurs when the price revisits a supply or demand zone but fails to break through it. Specifically, during a retest, the wick of a candlestick enters the zone, but the candle closes below the supply zone or above the demand zone. This price action suggests that the zone remains a strong area of resistance or support, as the market couldn't sustain movement beyond it. Traders often view such retests as confirmations to enter positions in the direction opposite to the zone's boundary. For instance, if the price retests a supply zone and fails to close above it, it may signal a selling opportunity. Conversely, a failed retest of a demand zone could indicate a buying opportunity. Monitoring the number of retests can provide insights into the strength of these zones; multiple retests without a breakout may reinforce the zone's significance. Here you can see how many times the price retested the supply or demand zone.
⚠ Timeframe Restriction: The selected timeframes for analysis cannot be lower than the chart’s current timeframe to ensure proper data alignment.
⏰ALERTS
This screener supports alerts, so you never miss a key market move. You can choose to receive alerts when a new demand or supply zone is created, helping you spot potential trading opportunities. Additionally, you can enable alerts for retests, which notify you when the price returns to test a previously identified zone. The alerts will work for each enabled ticker in the settings.
⚙️SETTINGS
1. General Configuration
- Detection Method : There are two detection methods you can choose from for identifying Supply & Demand Zones. Both methods aim to identify key areas where price is likely to react, but they do so using different approaches. Traders can choose the method that aligns with their trading style and time horizon.
- Sensitivity : The Sensitivity setting allows traders to adjust how aggressively the script identifies supply and demand zones when using the Momentum Detection Method. This setting directly impacts the threshold for detecting zones when using the momentum detection method.
High Sensitivity -> Detects smaller price movements, resulting in more zones being identified. This is ideal for traders who want to capture even minor supply and demand imbalances and prefer a higher frequency of potential trading opportunities.
Medium Sensitivity -> Balances between detecting significant price movements and avoiding excessive noise. This setting is suitable for most traders who want a moderate number of zones without being overwhelmed.
Low Sensitivity -> Focuses on larger, more significant price movements, resulting in fewer zones being identified. This is ideal for traders who prioritize quality over quantity and prefer to focus on the most impactful supply and demand areas.
Lowest Sensitivity -> Detects only the strongest and most pronounced price movements, identifying the most significant zones. This setting is best for traders who want to focus on high-probability, high-impact zones and avoid minor fluctuations. - Zone Invalidation : The Zone Invalidation setting determines how supply and demand zones are invalidated.
Wick -> A zone is invalidated if a candle’s wick goes below a demand zone or above a supply zone.
Close -> A zone is invalidated if a candle closes below a demand zone or above a supply zone. - Zone Visibility Range : The Zone Visibility Range setting controls how far from the current price supply and demand zones are displayed on the chart. It helps traders focus on relevant zones while avoiding clutter from distant or less impactful areas.
- Minimum Zone Width : The Minimum Zone Width setting defines the smallest size a supply or demand zone must have to be displayed on the chart. It uses the Average True Range (ATR) as a reference to ensure zones are proportionate to current market volatility.
- Minimum Zone Length : The Minimum Zone Length setting determines the minimum number of bars a supply or demand zone must span to be displayed on the chart. This setting helps filter out short-lived or insignificant zones, ensuring only meaningful areas of supply or demand are highlighted.
2. Tickers
You can set, then enable or disable up to 8 tickers in this section to get informed about their latest supply or demand zone.
發行說明
- The screener now supports up to 15 tickers!
- Reworked UI for visual clarity. Customization of the dashboard is also improved with new secondary colors being added.
- The default screener position is now top right of the chart.
發行說明
- Swapped "Approaching | Supply" and "Approaching | Demand" colors.
僅限邀請腳本
僅作者批准的使用者才能訪問此腳本。您需要申請並獲得使用許可,通常需在付款後才能取得。更多詳情,請依照作者以下的指示操作,或直接聯絡fluxchart。
TradingView不建議在未完全信任作者並了解其運作方式的情況下購買或使用腳本。您也可以在我們的社群腳本中找到免費的開源替代方案。
作者的說明
Get instant access at https://www.fluxcharts.com/?via=tv
Access Flux Charts' exclusive indicators: fluxcharts.com/
Join our Discord community: discord.gg/FluxCharts
Join our Discord community: discord.gg/FluxCharts
免責聲明
這些資訊和出版物並非旨在提供,也不構成TradingView提供或認可的任何形式的財務、投資、交易或其他類型的建議或推薦。請閱讀使用條款以了解更多資訊。