PROTECTED SOURCE SCRIPT
VIX Analytics
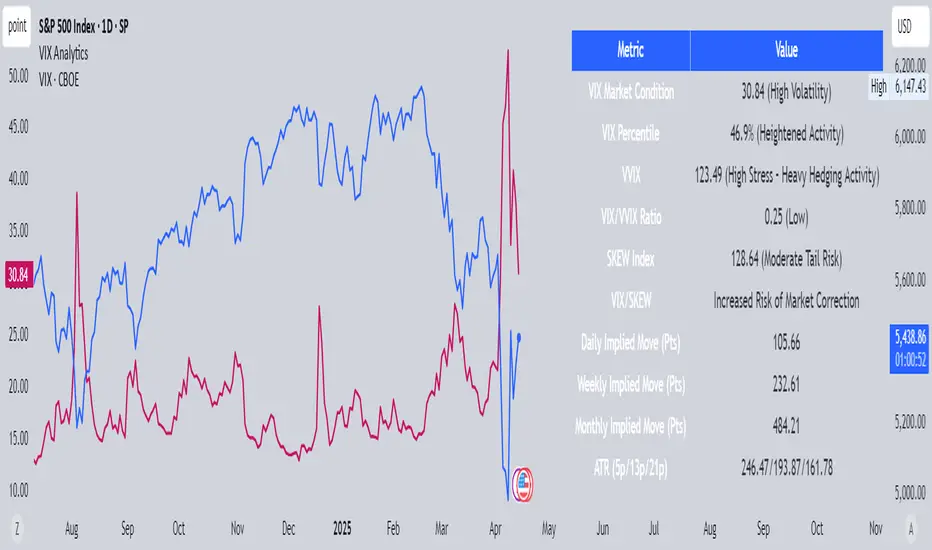
This script is designed to serve traders, analysts, and investors who want a real-time, comprehensive view of market volatility, risk sentiment, and implied movements. It combines multiple institutional-grade volatility indices into one clear dashboard and interprets them with actionable insights — directly on your chart.
🔍 Features Included
🟦VIX (CBOE Volatility Index)
Measures market expectation of 30-day S&P 500 volatility.
Color-coded interpretation ranges:
Under 13: Extreme Complacency
15–20: Stable Market
20–30: Moderate Risk
30–40: High Volatility
Over 40: Panic
🟪 VVIX (Volatility of Volatility Index)
Tracks the volatility of VIX itself.
Interpreted as a risk gauge of how aggressively traders are hedging volatility exposure.
Under 80: Market Complacency
80–100: Normal Environment
100–120: Caution — Rising Volatility of Volatility
Over 120: High Stress — Elevated Hedging Activity
🟨 SKEW Index
Measures the perceived tail risk of the S&P 500 — i.e., the probability of a black swan event.
Below 110: Potential Complacency
120–140: Moderate Tail Risk
Above 140: High Tail Risk
🧮 VIX/VVIX Ratio
Gauges relative fear levels between expected volatility and the volatility of volatility.
Under 0.5: Low Ratio — VVIX Overextended
Over 0.9: High Ratio — VIX Leading
📈 VIX Percentile (1-Year Range)
Shows where the current VIX sits relative to its 1-year high/low.
Under 20%: Volatility is Cheap
Over 70%: Fear is Elevated — Reversal Possible
📉 SPX Implied Point Moves
Projects expected moves in SPX using VIX-derived volatility:
Daily
Weekly
Monthly
Helps size positions or define expected price ranges based on volatility regime.
📊 ATR Values (5, 13, 21 periods)
Traditional volatility using historical prices.
Provided alongside implied data for comparison.
🧠 Unique Logic & Interpretation Layer
This script doesn’t just show raw data — it interprets it. It reads the relationship between VIX, VVIX, and SKEW to highlight:
When market volatility may be underpriced
When hidden tail risks are forming
When to be cautious of volatility expansions
How current implied movement compares to past realized volatility
✅ Use Cases
Day traders: Know when volatility is low or expanding before scalping or swinging.
Options traders: Identify whether implied volatility is cheap or expensive.
Portfolio managers: Gauge when hedging is in demand and adjust exposure.
Risk managers: Crosscheck if current volatility aligns with macro risk events.
⚙️ Settings
Customizable table placement: Move the dashboard to any corner of your chart.
No repainting or lag: Data updates in real-time using official CBOE and SPX feeds.
受保護腳本
此腳本以閉源形式發佈。 不過,您可以自由使用,沒有任何限制 — 點擊此處了解更多。
免責聲明
這些資訊和出版物並非旨在提供,也不構成TradingView提供或認可的任何形式的財務、投資、交易或其他類型的建議或推薦。請閱讀使用條款以了解更多資訊。
受保護腳本
此腳本以閉源形式發佈。 不過,您可以自由使用,沒有任何限制 — 點擊此處了解更多。
免責聲明
這些資訊和出版物並非旨在提供,也不構成TradingView提供或認可的任何形式的財務、投資、交易或其他類型的建議或推薦。請閱讀使用條款以了解更多資訊。