OPEN-SOURCE SCRIPT
Adjusted Average Volatility
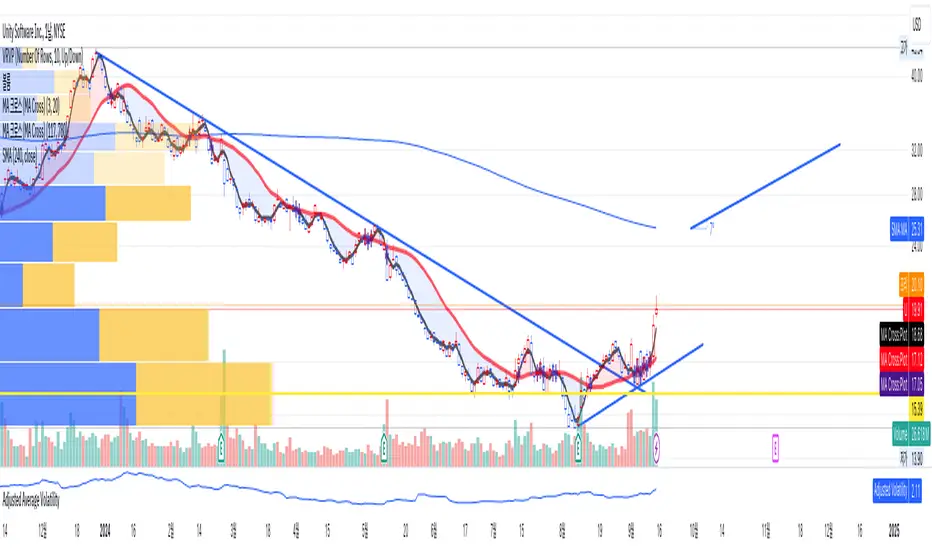
This Pine Script calculates the average volatility over the past 20 bars by taking the difference between the high and low prices. It then adjusts this volatility based on the previous closing price: if the price is below $20, the volatility is multiplied by 2, and if it’s above $20, the volatility is multiplied by 1.5. The adjusted volatility is then plotted on the chart, helping traders visualize how volatility changes relative to the asset's price level.
開源腳本
秉持TradingView一貫精神,這個腳本的創作者將其設為開源,以便交易者檢視並驗證其功能。向作者致敬!您可以免費使用此腳本,但請注意,重新發佈代碼需遵守我們的社群規範。
免責聲明
這些資訊和出版物並非旨在提供,也不構成TradingView提供或認可的任何形式的財務、投資、交易或其他類型的建議或推薦。請閱讀使用條款以了解更多資訊。
免責聲明
這些資訊和出版物並非旨在提供,也不構成TradingView提供或認可的任何形式的財務、投資、交易或其他類型的建議或推薦。請閱讀使用條款以了解更多資訊。