OPEN-SOURCE SCRIPT
已更新 ThiccZones
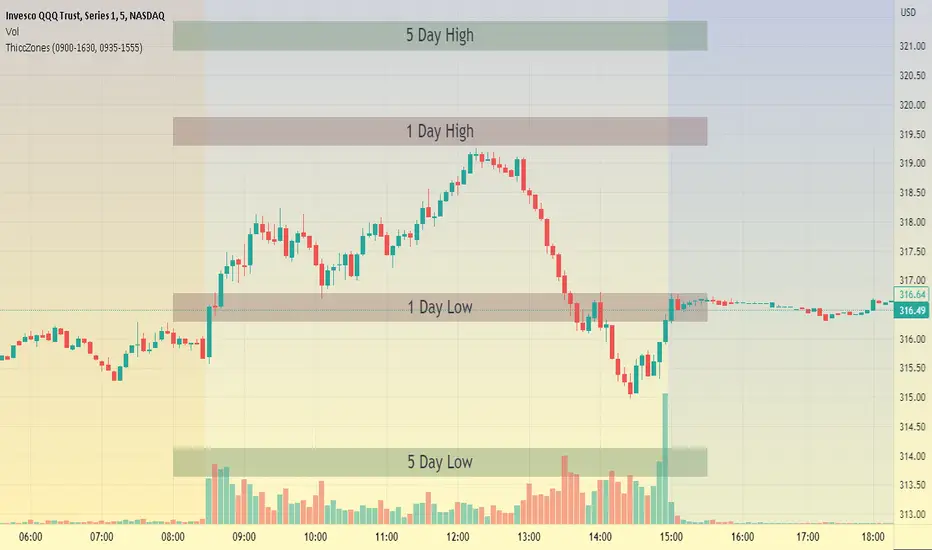
This indicator is a formula that includes 4 different zones which are different sizes based on the ticker you decide to use. It was optimized for SPY and other market ETFs but works well for all stocks on the market. The formula puts a zone at the previous day's high and low, and the previous 5 day's high and low. These zones are meant to be used as support and resistance and can even overlap, creating a 'master zone'. This is different than other zone indicators because the formula for these zones is something I created myself and have been unable to find on here. I have had the most success using a 1-15 minute chart and using my zones for reversal areas. I often look for other indications of reversal as well that line up with the area of the zones. It can also be used on the break and retest of these zones. I have found that when a stock breaks one of these zones it will often retest and continue that trend.
發行說明
Version 2.0 allows for the zones to be used regardless of extended hours or regular hours. We also added a label for each zone to help you identify them.發行說明
Fixed bug with 5 day low開源腳本
本著TradingView的真正精神,此腳本的創建者將其開源,以便交易者可以查看和驗證其功能。向作者致敬!雖然您可以免費使用它,但請記住,重新發佈程式碼必須遵守我們的網站規則。
免責聲明
這些資訊和出版物並不意味著也不構成TradingView提供或認可的金融、投資、交易或其他類型的意見或建議。請在使用條款閱讀更多資訊。
開源腳本
本著TradingView的真正精神,此腳本的創建者將其開源,以便交易者可以查看和驗證其功能。向作者致敬!雖然您可以免費使用它,但請記住,重新發佈程式碼必須遵守我們的網站規則。
免責聲明
這些資訊和出版物並不意味著也不構成TradingView提供或認可的金融、投資、交易或其他類型的意見或建議。請在使用條款閱讀更多資訊。