OPEN-SOURCE SCRIPT
已更新 BB %b & RSI Indicator & Alert
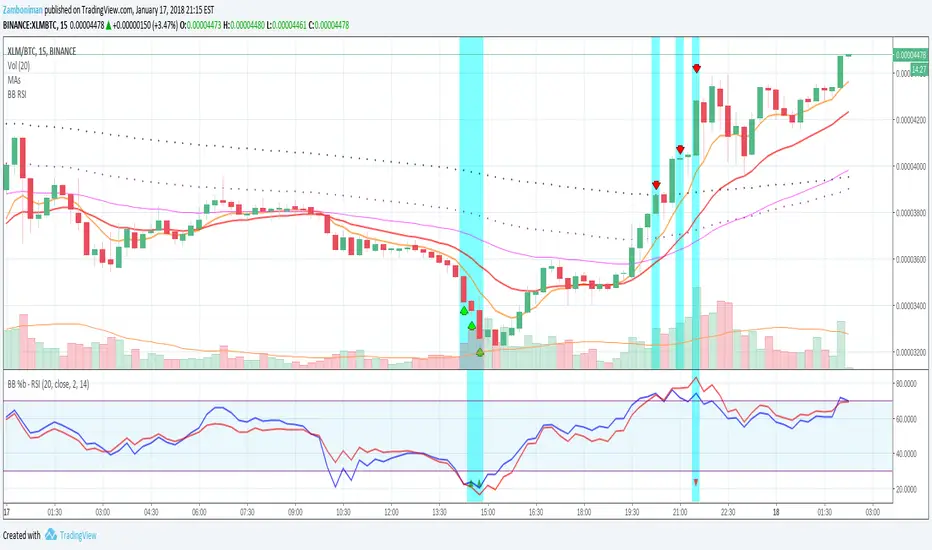
Indicator for displaying both RSI and a normalized Bollinger Bands %b (Usual 0 - 1 range of BB normalized to the 30 - 70 OB/OS range of RSI) simultaneously.
Settable periods for RSI and BB, and settable standard deviation for BB.
When both Bollinger Bands %b and RSI are OB/OS then the column will turn blue and a buy/sell arrow will appear in the indicator provided other conditions pertaining to the OB/OS condition in one of the last two candles are also met.
You can also set an alert on the arrow indicator appearing.
I use this mainly for Cryptocurrencies, though it is usable in Forex, for shorter time periods to indicate possible trade opportunities.
發行說明
Small bugfix發行說明
Small bugfix發行說明
- Several enhancements and tweaks- Added selectable combination alert or individual buy or sell alerts
- Moved buy and sell arrows to opposite sides to enhance visibility (often obscured by plot lines before)
發行說明
Fixed typo in alert.發行說明
small fix發行說明
Removed limitation for up/down arrows only on 60 minute charts or less. Added separate alerts for buy or sell. A few other small tweaks.發行說明
Small tweaks.開源腳本
秉持TradingView一貫精神,這個腳本的創作者將其設為開源,以便交易者檢視並驗證其功能。向作者致敬!您可以免費使用此腳本,但請注意,重新發佈代碼需遵守我們的社群規範。
免責聲明
這些資訊和出版物並非旨在提供,也不構成TradingView提供或認可的任何形式的財務、投資、交易或其他類型的建議或推薦。請閱讀使用條款以了解更多資訊。
開源腳本
秉持TradingView一貫精神,這個腳本的創作者將其設為開源,以便交易者檢視並驗證其功能。向作者致敬!您可以免費使用此腳本,但請注意,重新發佈代碼需遵守我們的社群規範。
免責聲明
這些資訊和出版物並非旨在提供,也不構成TradingView提供或認可的任何形式的財務、投資、交易或其他類型的建議或推薦。請閱讀使用條款以了解更多資訊。