PROTECTED SOURCE SCRIPT
已更新 CandlestickPatterns
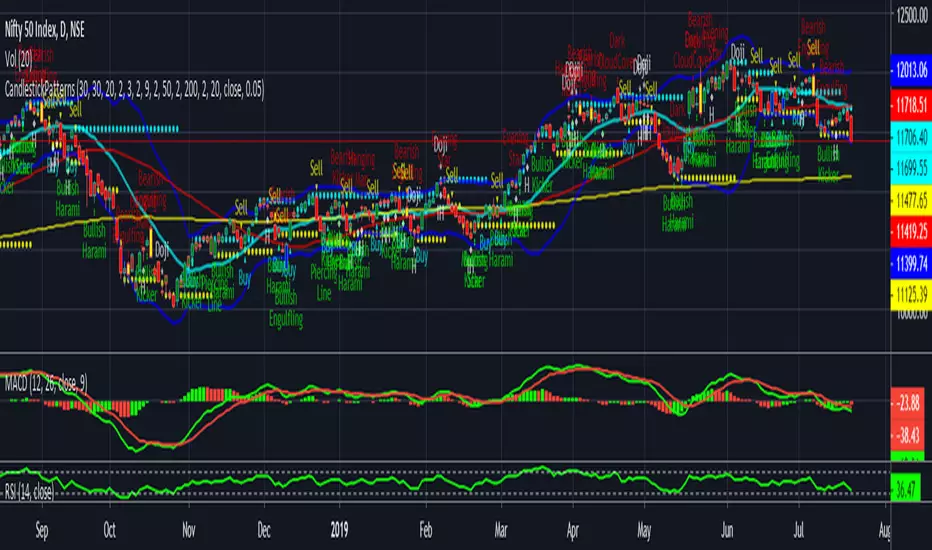
If moving average SMA (green line) crosses above SMA (red line) is uptrend , stock price will move up gradually. If suppose moving average SMA (green line) crosses below SMA (red line) is downtrend, stock price will move down. Also please validate with MACD & RSI for reference will get more clarification.
The default script have:
1) Bollinger Bands
2) Moving Average
3) Buy & Sell Signals
4) Engulfing patterns (like Doji , Bearish Harami, Bullish Harami, Bearish Engulfing , Bullish Engulfing , Piercing Line, Bullish Belt, Bullish Kicker, and Bearish Kicker)
The Piercing Line, Bullish Belt, and the Kickers will usually show up better in the daily charts.
發行說明
If moving average SMA (green line) crosses above SMA (red line) is uptrend , stock price will move up gradually. If suppose moving average SMA (green line) crosses below SMA (red line) is downtrend, stock price will move down. Also please validate with MACD & RSI for reference will get more clarification. The default script have:
1) Bollinger Bands
2) Moving Average
3) Buy & Sell Signals
4) Engulfing patterns (like Doji , Bearish Harami, Bullish Harami, Bearish Engulfing , Bullish Engulfing , Piercing Line, Bullish Belt, Bullish Kicker, and Bearish Kicker)
The Piercing Line, Bullish Belt, and the Kickers will usually show up better in the daily charts.
#update only buy & sell signal identification with new triangle symbol.
發行說明
++Engulfing Colour Change發行說明
Update Support and Resistance are added.support--> Orange Colour
Resistance--> Aqua Colour
發行說明
#Moving Averages SMA50 & SMA200 are added.發行說明
#Colour DetailsSMA3--> lime
SMA9--> red
SMA20--> green
SMA50--> fuchsia
SMA200--> orange
Support--> yellow
Resistance--> aqua
發行說明
## 50days and 200days SMA color change 50days SMA--> orange
200days SMA--> yellow
發行說明
##發行說明
#20 days MA colour--> Aqua發行說明
Update with Support and Resistance發行說明
colour change 受保護腳本
此腳本以閉源形式發佈。 不過,您可以自由使用,沒有任何限制 — 點擊此處了解更多。
免責聲明
這些資訊和出版物並非旨在提供,也不構成TradingView提供或認可的任何形式的財務、投資、交易或其他類型的建議或推薦。請閱讀使用條款以了解更多資訊。
受保護腳本
此腳本以閉源形式發佈。 不過,您可以自由使用,沒有任何限制 — 點擊此處了解更多。
免責聲明
這些資訊和出版物並非旨在提供,也不構成TradingView提供或認可的任何形式的財務、投資、交易或其他類型的建議或推薦。請閱讀使用條款以了解更多資訊。