OPEN-SOURCE SCRIPT
Chebyshev-Gauss Convergence Divergence
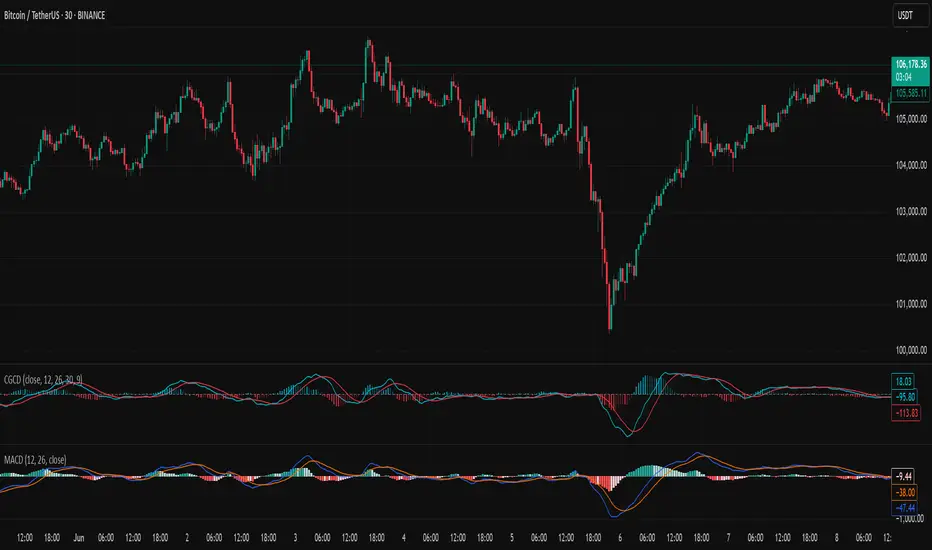
The Chebyshev-Gauss Convergence Divergence is a momentum indicator that leverages the Chebyshev-Gauss Moving Average (CG-MA) to provide a smoother and more responsive alternative to traditional oscillators like the MACD. For more information see the moving average script: 
How it works:
How to use:
How it works:
- It calculates a fast CG-MA and a slow CG-MA. The CG-MA uses Gauss-Chebyshev quadrature to compute a weighted average, which can offer a better trade-off between lag and smoothness compared to simple or exponential MAs.
- The Oscillator line is the difference between the fast CG-MA and the slow CG-MA.
- A Signal Line, which is a simple moving average of the Oscillator line, is plotted to show the average trend of the oscillator.
- A Histogram is plotted, representing the difference between the Oscillator and the Signal Line. The color of the histogram bars changes to indicate whether momentum is strengthening or weakening.
How to use:
- Crossovers: A buy signal can be generated when the Oscillator line crosses above the Signal line. A sell signal can be generated when it crosses below.
- Zero Line: When the Oscillator crosses above the zero line, it indicates upward momentum (fast MA is above slow MA).When it crosses below zero, it indicates downward momentum.
- Divergence: Like with the MACD, look for divergences between the oscillator and price action to spot potential reversals.
- Histogram: The histogram provides a visual representation of the momentum. When the bars are growing, momentum is increasing. When they are shrinking, momentum is fading.
開源腳本
秉持TradingView一貫精神,這個腳本的創作者將其設為開源,以便交易者檢視並驗證其功能。向作者致敬!您可以免費使用此腳本,但請注意,重新發佈代碼需遵守我們的社群規範。
免責聲明
這些資訊和出版物並非旨在提供,也不構成TradingView提供或認可的任何形式的財務、投資、交易或其他類型的建議或推薦。請閱讀使用條款以了解更多資訊。
免責聲明
這些資訊和出版物並非旨在提供,也不構成TradingView提供或認可的任何形式的財務、投資、交易或其他類型的建議或推薦。請閱讀使用條款以了解更多資訊。