PROTECTED SOURCE SCRIPT
Trend Dashboard
Trend Dashboard Indicator
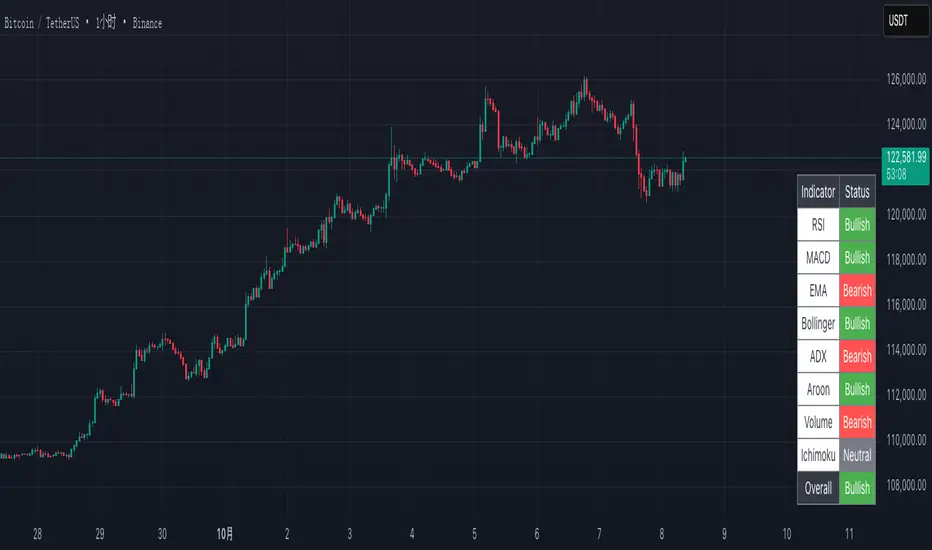
The Trend Dashboard is a custom TradingView Pine Script v5 indicator designed to provide a comprehensive analysis of Bitcoin (BTCUSD) market trends across multiple timeframes. It evaluates eight popular technical indicators—RSI, MACD, EMA, Bollinger Bands, ADX, Aroon, Volume, and Ichimoku Cloud—and displays their bullish, bearish, or neutral status in a clear, color-coded table in the bottom-right corner of the chart. Additionally, it calculates an overall trend assessment based on the collective signals of these indicators, making it a valuable tool for traders seeking a quick, at-a-glance view of market conditions.
The Trend Dashboard is a custom TradingView Pine Script v5 indicator designed to provide a comprehensive analysis of Bitcoin (BTCUSD) market trends across multiple timeframes. It evaluates eight popular technical indicators—RSI, MACD, EMA, Bollinger Bands, ADX, Aroon, Volume, and Ichimoku Cloud—and displays their bullish, bearish, or neutral status in a clear, color-coded table in the bottom-right corner of the chart. Additionally, it calculates an overall trend assessment based on the collective signals of these indicators, making it a valuable tool for traders seeking a quick, at-a-glance view of market conditions.
受保護腳本
此腳本以閉源形式發佈。 不過,您可以自由且不受任何限制地使用它 — 在此處了解更多資訊。
免責聲明
這些資訊和出版物並不意味著也不構成TradingView提供或認可的金融、投資、交易或其他類型的意見或建議。請在使用條款閱讀更多資訊。
免責聲明
這些資訊和出版物並不意味著也不構成TradingView提供或認可的金融、投資、交易或其他類型的意見或建議。請在使用條款閱讀更多資訊。