PROTECTED SOURCE SCRIPT
📈 Aidous-Comprehensive Trend Signal Matrix
📈 Aidous-Comprehensive Trend Signal Matrix
A powerful, multi-dimensional trend analysis tool that aggregates signals from 24+ technical indicators across 6 key categories:
Pure Trend Indicators (SuperTrend, Ichimoku, EMA Crossover, Parabolic SAR, etc.)
Momentum Oscillators (RSI, MACD, CCI, Stochastic RSI, Awesome Oscillator)
Volatility-Based Tools (Bollinger Bands, Choppiness Index)
Volume & Flow Indicators (Chaikin Money Flow, OBV)
Price Action Filters (Higher Highs/Lower Lows, Fractals)
Custom & Proprietary Logic (Wolfpack ID, Waddah Attar Explosion, Trend Magic)
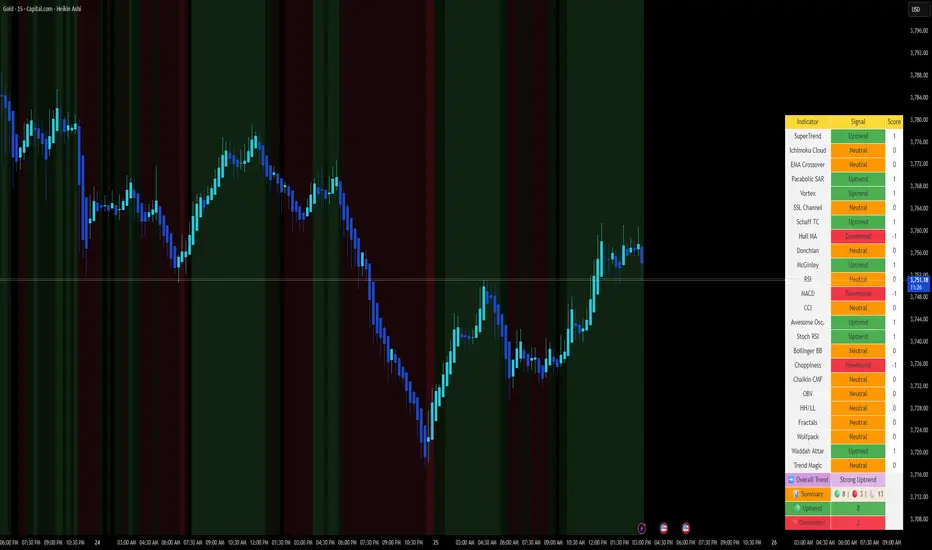
This indicator doesn’t just show one signal—it synthesizes 24 independent trend signals into a unified matrix, giving you a holistic view of market direction. The Overall Trend is dynamically classified as:
Strong Uptrend (≥ +5 net bullish signals)
Uptrend (+1 to +4)
Neutral (balanced or conflicting signals)
Downtrend (–1 to –4)
Strong Downtrend (≤ –5 net bearish signals)
📊 Interactive Table Display
Choose between Full Table (detailed per-indicator breakdown) or Compact Summary mode. Customize position and size to fit your chart layout.
🎨 Visual Feedback
Background color changes based on overall trend strength
Color-coded signal cells (green = bullish, red = bearish, orange = neutral)
Real-time signal counts for quick sentiment assessment
💡 How to Use:
Use the Overall Trend for high-level market bias
Drill into the table to identify which indicators are driving the signal
Combine with your own strategy for confluence-based entries/exits
⚠️ Disclaimer:
This script is provided "as is" without warranty of any kind. Past performance is not indicative of future results. Always conduct your own analysis and risk management.
A powerful, multi-dimensional trend analysis tool that aggregates signals from 24+ technical indicators across 6 key categories:
Pure Trend Indicators (SuperTrend, Ichimoku, EMA Crossover, Parabolic SAR, etc.)
Momentum Oscillators (RSI, MACD, CCI, Stochastic RSI, Awesome Oscillator)
Volatility-Based Tools (Bollinger Bands, Choppiness Index)
Volume & Flow Indicators (Chaikin Money Flow, OBV)
Price Action Filters (Higher Highs/Lower Lows, Fractals)
Custom & Proprietary Logic (Wolfpack ID, Waddah Attar Explosion, Trend Magic)
This indicator doesn’t just show one signal—it synthesizes 24 independent trend signals into a unified matrix, giving you a holistic view of market direction. The Overall Trend is dynamically classified as:
Strong Uptrend (≥ +5 net bullish signals)
Uptrend (+1 to +4)
Neutral (balanced or conflicting signals)
Downtrend (–1 to –4)
Strong Downtrend (≤ –5 net bearish signals)
📊 Interactive Table Display
Choose between Full Table (detailed per-indicator breakdown) or Compact Summary mode. Customize position and size to fit your chart layout.
🎨 Visual Feedback
Background color changes based on overall trend strength
Color-coded signal cells (green = bullish, red = bearish, orange = neutral)
Real-time signal counts for quick sentiment assessment
💡 How to Use:
Use the Overall Trend for high-level market bias
Drill into the table to identify which indicators are driving the signal
Combine with your own strategy for confluence-based entries/exits
⚠️ Disclaimer:
This script is provided "as is" without warranty of any kind. Past performance is not indicative of future results. Always conduct your own analysis and risk management.
受保護腳本
此腳本以閉源形式發佈。 不過,您可以自由使用,沒有任何限制 — 點擊此處了解更多。
免責聲明
這些資訊和出版物並非旨在提供,也不構成TradingView提供或認可的任何形式的財務、投資、交易或其他類型的建議或推薦。請閱讀使用條款以了解更多資訊。
受保護腳本
此腳本以閉源形式發佈。 不過,您可以自由使用,沒有任何限制 — 點擊此處了解更多。
免責聲明
這些資訊和出版物並非旨在提供,也不構成TradingView提供或認可的任何形式的財務、投資、交易或其他類型的建議或推薦。請閱讀使用條款以了解更多資訊。