OPEN-SOURCE SCRIPT
Median / Averages from Lower Time-Frame Ticks
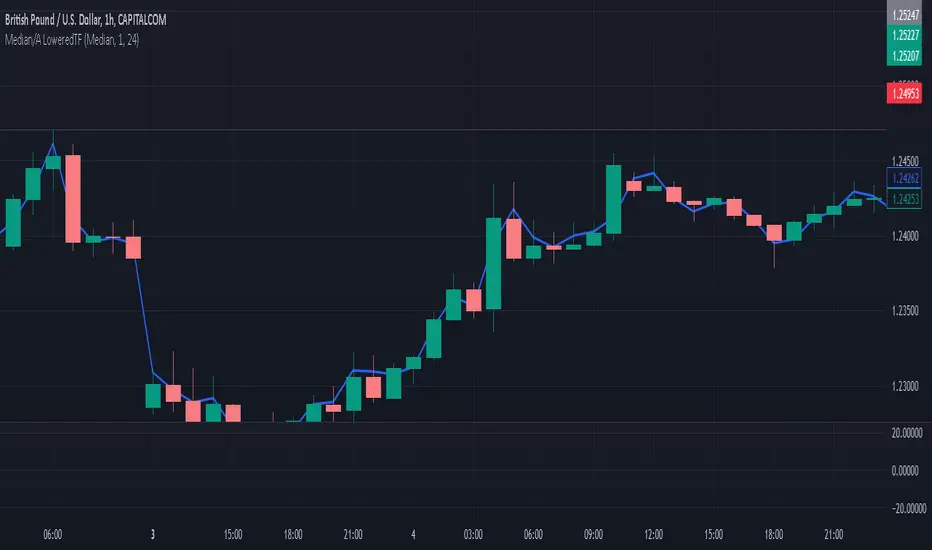
I've added/created this to give me a more accurate idea of candle movements - I use the MEDIAN average of a candle, which gives me a more accurate "description" of where the candle spent most of it's time 'hovering', over that time frame. The beauty of this is how it REDUCES NOISE, espeicially long wicks, or candles that spike at the moment of a close, skewing a 'normalized' candle's result.
Due to how the Median Calculation works, changing the 'candle timeframe' in options will have no effect - that is available as an option for some of the more traditional MA's, which you can toggle between in the settings... it can also display traditional MA's - SMA, HMA, WMA, and the HLC/3 which I was using up until this point.
This is a 'Line Chart' version of this indicator; I intend to update it with a 'normalized', custom drawn candle based on this method.
The MEDIAN of a candle is a value based on the following;
it lines all values up over a time frame, then takes the value closest to the centre of the array as the 'median'. I'll provide a working example.
imagine we have a candle with 5 values;
it opens at 2, spikes up to 1, spikes down to 10, then spends the entire time hovering at 3 and 4 until it's close. Our array looks like this;
1,2,3,4,100
now, the "average" of these candles is (1+2+3+4+100) / 5 = 22
when the "median" of these candles is the centre value of the array, which is 3.
The candle spent 99% of it's time between 1 and 4 - and spiked for one moment to 100... so now the median gives me a better idea of where the price spent most of it's time, in this instance.
This becomes more skewed, and therefore more accurate, the more values in a candle - and the minute chart on the hourly is a good baseline that gives pretty fair values, without being overly taxing on the machine that needs to make those calculations.
Caveat: I Trade on the Hourly/Daily, so the medians are taken from Minute Candles - thus this will effectively be 'no good' for 1 minute time-frames, (it will simply draw at the Close) but will still have some value down to 15 minute, or even 5 minute charts.
開源腳本
秉持TradingView一貫精神,這個腳本的創作者將其設為開源,以便交易者檢視並驗證其功能。向作者致敬!您可以免費使用此腳本,但請注意,重新發佈代碼需遵守我們的社群規範。
免責聲明
這些資訊和出版物並非旨在提供,也不構成TradingView提供或認可的任何形式的財務、投資、交易或其他類型的建議或推薦。請閱讀使用條款以了解更多資訊。
開源腳本
秉持TradingView一貫精神,這個腳本的創作者將其設為開源,以便交易者檢視並驗證其功能。向作者致敬!您可以免費使用此腳本,但請注意,重新發佈代碼需遵守我們的社群規範。
免責聲明
這些資訊和出版物並非旨在提供,也不構成TradingView提供或認可的任何形式的財務、投資、交易或其他類型的建議或推薦。請閱讀使用條款以了解更多資訊。