OPEN-SOURCE SCRIPT
已更新 VVIX/VIX Ratio with Interpretation Levels
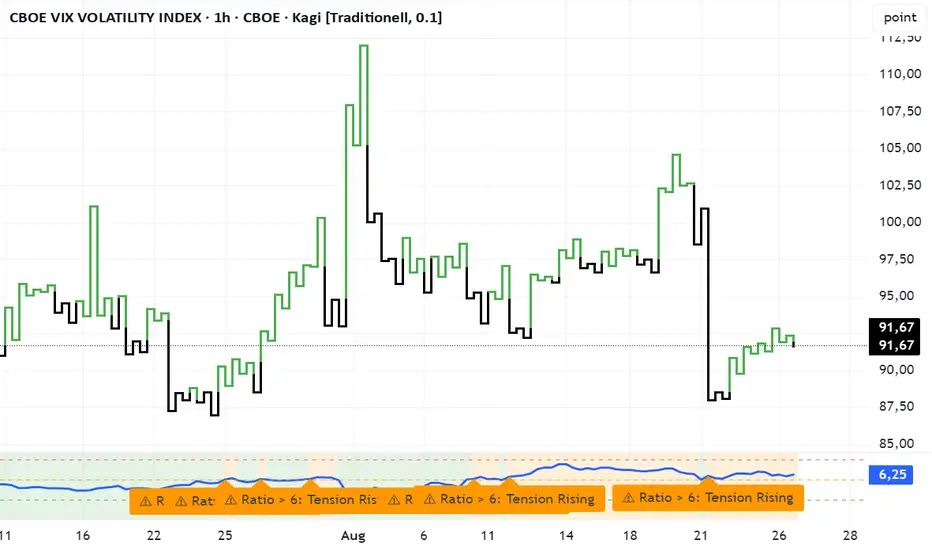
VVIX/VIX Ratio with Interpretation Levels
This indicator plots the ratio of VVIX (Volatility of Volatility Index) to VIX (CBOE Volatility Index) in a separate panel.
The ratio highlights when the options market is pricing unusually high volatility in volatility (VVIX) relative to the base volatility index (VIX).
Ratio < 5 → Complacency: Markets expect stability; often a pre-shock zone.
5–6 → Tension Building: Traders begin hedging volatility risk while VIX remains low.
6–7 → Elevated Risk: Divergence warns of potential regime change in volatility.
> 7 → High-Risk Zone: Options market pricing aggressive swings; can precede volatility spikes in equities.
The script also includes dashed interpretation lines (5, 6, 7) and automatic labels when key thresholds are crossed.
Background shading helps visualize current regime.
Use cases:
Detect hidden stress when VIX remains calm but VVIX rises.
Anticipate potential volatility regime shifts.
Support risk management and timing of long/short volatility strategies.
發行說明
DescriptionThe VVIX/VIX Ratio Indicator plots the ratio of the CBOE VVIX (Volatility of Volatility Index) to the CBOE VIX (Volatility Index) in a separate panel.
This ratio is a useful signal to detect when the options market is pricing volatility-of-volatility significantly higher relative to equity volatility.
Interpretation Levels
Ratio < 5 → Complacency – Market calm, often precedes shocks
5–6 → Tension Building – Options traders begin hedging, VIX still calm
6–7 → Elevated Risk – Divergence may indicate regime shift
> 7 → High-Risk Zone – Panic or crisis pricing, potential volatility spike
Features:
Colored background zones (complacency → high risk)
Horizontal threshold lines at 5, 6, 7
Automatic labels when levels are crossed
Clean ratio visualization with customizable levels
Use Cases:
Early warning system for hidden stress when VIX remains low
Risk management for volatility strategies
Identifying regime changes in volatility pricing
License
Open Source – MIT License (2025).
Free to use, share, and modify with attribution.
Disclaimer: This script is for educational purposes only and does not constitute financial advice. Use at your own risk.
開源腳本
秉持TradingView一貫精神,這個腳本的創作者將其設為開源,以便交易者檢視並驗證其功能。向作者致敬!您可以免費使用此腳本,但請注意,重新發佈代碼需遵守我們的社群規範。
免責聲明
這些資訊和出版物並非旨在提供,也不構成TradingView提供或認可的任何形式的財務、投資、交易或其他類型的建議或推薦。請閱讀使用條款以了解更多資訊。
免責聲明
這些資訊和出版物並非旨在提供,也不構成TradingView提供或認可的任何形式的財務、投資、交易或其他類型的建議或推薦。請閱讀使用條款以了解更多資訊。