OPEN-SOURCE SCRIPT
Average True Range Percent
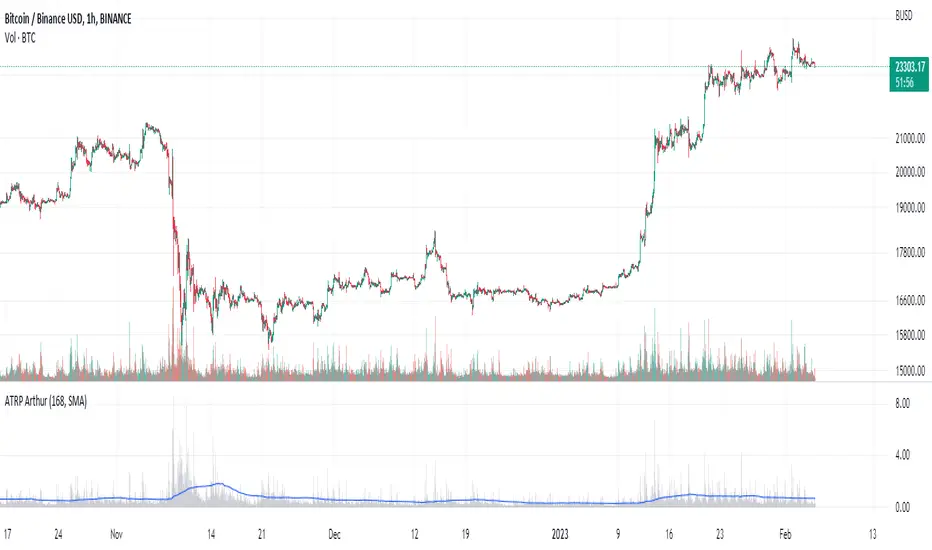
When writing the Quickfingers Luc base scanner (Marvin) script, I wanted a measure of volatility that would be comparable between charts. The traditional Average True Range (ATR) indicator calculates a discrete number providing the average true range of that chart for a specified number of periods. The ATR is not comparable across different price charts.
Average True Range Percent (ATRP) measures the true range for the period, converts it to a percentage using the average of the period's range ((high + low) / 2) and then smooths the percentage. The ATRP provides a measure of volatility that is comparable between charts showing their relative volatility.
Enjoy.
開源腳本
秉持TradingView一貫精神,這個腳本的創作者將其設為開源,以便交易者檢視並驗證其功能。向作者致敬!您可以免費使用此腳本,但請注意,重新發佈代碼需遵守我們的社群規範。
免責聲明
這些資訊和出版物並非旨在提供,也不構成TradingView提供或認可的任何形式的財務、投資、交易或其他類型的建議或推薦。請閱讀使用條款以了解更多資訊。
免責聲明
這些資訊和出版物並非旨在提供,也不構成TradingView提供或認可的任何形式的財務、投資、交易或其他類型的建議或推薦。請閱讀使用條款以了解更多資訊。