PROTECTED SOURCE SCRIPT
JXMJXRS - T3 Stack Aligner (Smooth)
The JXMJXRS - T3 Stack Aligner is a multi-timeframe trend confirmation tool that uses a smoothed moving average known as the T3. The T3 is built using six layers of exponential moving averages to reduce noise and lag while maintaining a smoother appearance than traditional moving averages. This indicator helps identify when multiple timeframes are aligned in the same direction, giving greater clarity on whether a trend is strong and consistent.
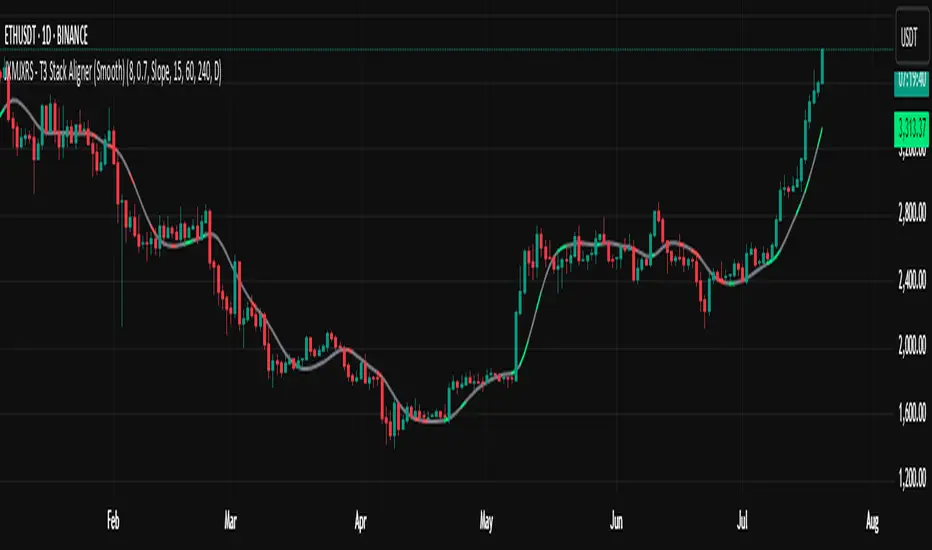
The indicator plots a single T3 line on the chart and changes its colour depending on whether all selected timeframes are showing the same trend direction. This trend condition is based on either the slope of the T3 or a price comparison with the T3, depending on which method is selected. When all timeframes agree that the market is trending up, the line turns green. When they all agree that it is trending down, the line turns red. If the timeframes are not in agreement, the line appears grey. This helps traders avoid uncertainty during periods of mixed or unclear trend behaviour.
The settings allow the user to control how the T3 line is calculated and how trend alignment is measured. The T3 Length setting adjusts how long the base smoothing period is, and the Smoothing Factor controls the weight used in the T3 calculation. The Trend Method lets the user choose between detecting trend direction by slope or by comparing price to the T3. Finally, four timeframes can be selected. All four must meet the trend condition for the green or red colour to appear. If even one timeframe is out of sync, the line will remain grey until alignment returns.
This tool is designed for traders who want to stay aligned with the broader trend across multiple timeframes and filter out short-term noise. It does not provide signals but supports trend-following strategies by confirming direction with stronger confluence.
受保護腳本
此腳本以閉源形式發佈。 不過,您可以自由使用,沒有任何限制 — 點擊此處了解更多。
免責聲明
這些資訊和出版物並非旨在提供,也不構成TradingView提供或認可的任何形式的財務、投資、交易或其他類型的建議或推薦。請閱讀使用條款以了解更多資訊。
免責聲明
這些資訊和出版物並非旨在提供,也不構成TradingView提供或認可的任何形式的財務、投資、交易或其他類型的建議或推薦。請閱讀使用條款以了解更多資訊。