OPEN-SOURCE SCRIPT
OG ATR Range
Description:
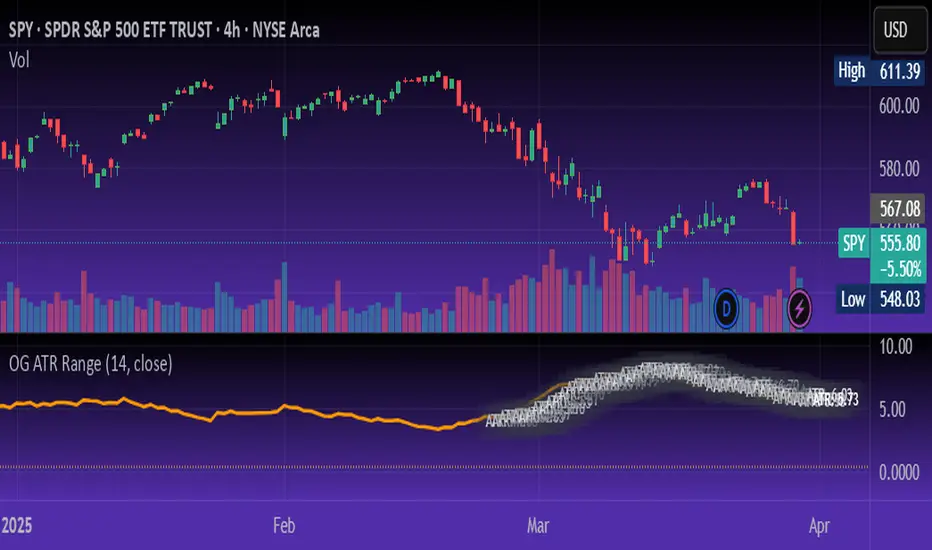
The OG ATR Tool is a clean, visualized version of the Average True Range indicator for identifying volatility, stop-loss levels, and realistic price movement expectations.
How it works:
Calculates the average range (in points/pips) of recent candles.
Overlays ATR bands to help define breakout potential or squeeze zones.
Can be used to size trades or set dynamic stop-loss and target levels.
Best for:
Intraday traders who want to avoid unrealistic targets.
Volatility-based setups and breakout strategies.
Creating position sizing rules based on instrument volatility.
Pro Tip: Combine with your trend indicators to set sniper entries and exits that respect volatility.
開源腳本
秉持TradingView一貫精神,這個腳本的創作者將其設為開源,以便交易者檢視並驗證其功能。向作者致敬!您可以免費使用此腳本,但請注意,重新發佈代碼需遵守我們的社群規範。
免責聲明
這些資訊和出版物並非旨在提供,也不構成TradingView提供或認可的任何形式的財務、投資、交易或其他類型的建議或推薦。請閱讀使用條款以了解更多資訊。
免責聲明
這些資訊和出版物並非旨在提供,也不構成TradingView提供或認可的任何形式的財務、投資、交易或其他類型的建議或推薦。請閱讀使用條款以了解更多資訊。