OPEN-SOURCE SCRIPT
已更新 Pivot Points with MID Levels

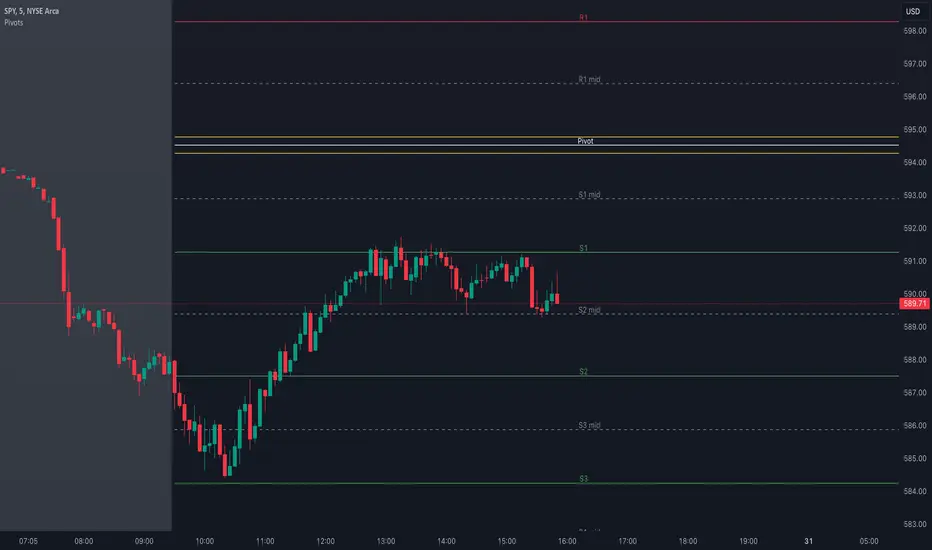
This indicator shows the Standard Pivot Points level based on daily values that can act as support and resistance. It is used by a variety of traders around the world. You can select which time frame Pivot Point Levels you'd like. Daily, weekly etc... Perfect for swing trading or day trading.
Pivot Points- Shows 3 levels of resistance, the Pivot Point and 3 levels of support
(R3, R2, R1, PIVOT POINT, S1, S2, S3
MID Levels- The MID levels are 50% retracement from the pivot point level above it and below
Example- R3, MID, R2, MID, R1, MID, PIVOT POINT, MID, S1, MID, S2, MID, S3
With this indicator you will also have the option to show the Previous days High and Low that are also important levels. On gap up/down days it is always interesting to see if price will close the gap, hence the important level to note.
PDH= Previous Days High
PDL= Previous Days Low
I have added a feature that you can now select specific color to each level and the line style for each level to help understand which levels are being show by personal needs.
Happy Trading
發行說明
This indicator shows the Standard Pivot Points level based on daily values that can act as support and resistance. It is used by a variety of traders around the world. You can select which time frame Pivot Point Levels you'd like. Daily, weekly etc... Perfect for swing trading or day trading.Pivot Points- Shows 3 levels of resistance, the Pivot Point and 3 levels of support
(R3, R2, R1, PIVOT POINT, S1, S2, S3
MID Levels- The MID levels are 50% retracement from the pivot point level above it and below
Example- R3, MID, R2, MID, R1, MID, PIVOT POINT, MID, S1, MID, S2, MID, S3
With this indicator you will also have the option to show the Previous days High and Low that are also important levels. On gap up/down days it is always interesting to see if price will close the gap, hence the important level to note.
PDH= Previous Days High
PDL= Previous Days Low
I have added a feature that you can now select specific color to each level and the line style for each level to help understand which levels are being show by personal needs.
UPDATE:
Added option to choose line thickness.
For those of you that would like to have 2 sets of Pivot Points such as one for the Daily Levels and the other for the Weekly Levels it will make it easier to see which level is what... As the example shows the Daily pivot Points can be set to "1" thickness and the weekly can be set with "4" thickness...
Happy Trading
發行說明
Added R4mid, R4, R5mid, R5 and S4mid, S4, S5mid, S5Also Removed PDH/PDL
發行說明
Added Central Pivot Range "CPR"Labels on chart shows as follow
TC = Top Central
BC = Bottom Central
NOTE !!!
if not desired please go to the colors option and bring it down to 0%
發行說明
added 2 exponential moving averages and some color changes to Pivot points發行說明
Minior bug fix發行說明
minor bug fix發行說明
Added moving averages with option to opt outadded VWAP that hides on a Daily chart and option to opt out
added Heiken Ashi Candle Overlay so it doesn't skew with the pivot point data for those who would like to use it in conjunction.
PS. go to chart settings > Symbol> and uncheck the candles colors. this way you wont have 2 sets of candles showing
發行說明
minor bug fix發行說明
Wanted to keep this indicator as simple as possible, i've created another indicator with the previous additions as a separate entity, this is for traders who are looking for pivot points solely.發行說明
fixed an error發行說明
added CPR by request發行說明
Updated to V6 發行說明
minor update 開源腳本
秉持TradingView一貫精神,這個腳本的創作者將其設為開源,以便交易者檢視並驗證其功能。向作者致敬!您可以免費使用此腳本,但請注意,重新發佈代碼需遵守我們的社群規範。
免責聲明
這些資訊和出版物並非旨在提供,也不構成TradingView提供或認可的任何形式的財務、投資、交易或其他類型的建議或推薦。請閱讀使用條款以了解更多資訊。
開源腳本
秉持TradingView一貫精神,這個腳本的創作者將其設為開源,以便交易者檢視並驗證其功能。向作者致敬!您可以免費使用此腳本,但請注意,重新發佈代碼需遵守我們的社群規範。
免責聲明
這些資訊和出版物並非旨在提供,也不構成TradingView提供或認可的任何形式的財務、投資、交易或其他類型的建議或推薦。請閱讀使用條款以了解更多資訊。