INVITE-ONLY SCRIPT
Eagles Compass
What is Eagles Compass?
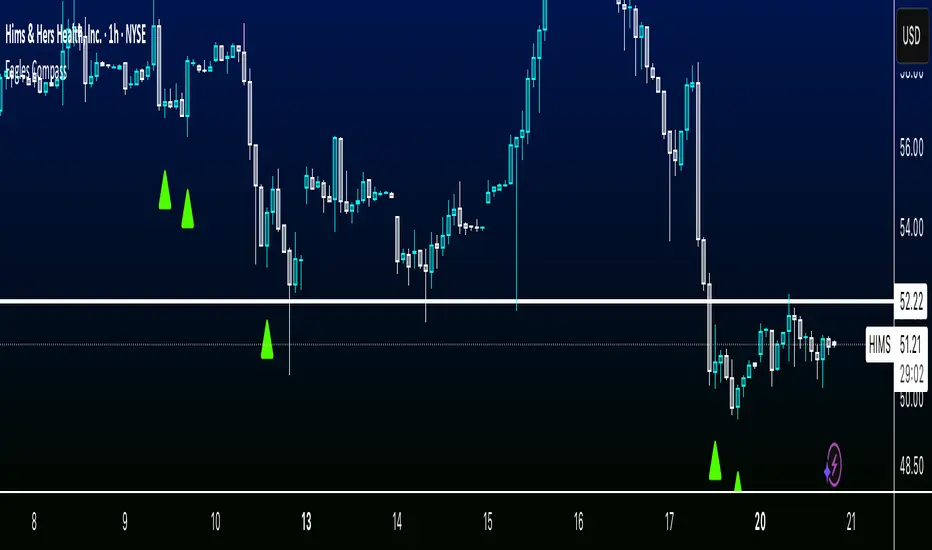
1HR, 2HR, 1D timeframe swing analysis script designed to help you spot squeezes, reversals, and large moves
Some stocks will work better on the 1HR timeframe, other stocks will have to be adjsuted to the 2HR or 1D timeframe based on volatility and average volume of the stock
There are some false positives as with any indicator. This is how you spot them:
If a red triangle appears near a support or new low and the stock is down quite a bit, or if it appears after the stock has already been down trending, it is invalid.
If a green triangle appears near a resistance or new high and the stock is already up a lot, or if it appears that the stock has been up trending for a while, it is invalid.
How does it work?
It's looking at key supports and resistances, reversal zones, and candle ratios to determine potential candles that might indicate an upcoming future move.
僅限邀請腳本
只有經作者批准的使用者才能訪問此腳本。您需要申請並獲得使用權限。該權限通常在付款後授予。如欲了解更多詳情,請依照以下作者的說明操作,或直接聯絡zenmarkets。
除非您完全信任其作者並了解腳本的工作原理,否則TradingView不建議您付費或使用腳本。您也可以在我們的社群腳本中找到免費的開源替代方案。
作者的說明
To request access to this invite-only script, please visit:
🔗 https://whop.com/egcompass
免責聲明
這些資訊和出版物並不意味著也不構成TradingView提供或認可的金融、投資、交易或其他類型的意見或建議。請在使用條款閱讀更多資訊。