PROTECTED SOURCE SCRIPT
已更新 Average Daily Range ADR by th
Special for Amer and ATR testing and some text for description which I will add a little bit later because beatiful tv can't pass my indicator to be published
發行說明
# Average Daily Range High Low v5 - ADR HiLo v5## 📊 Indicator Overview
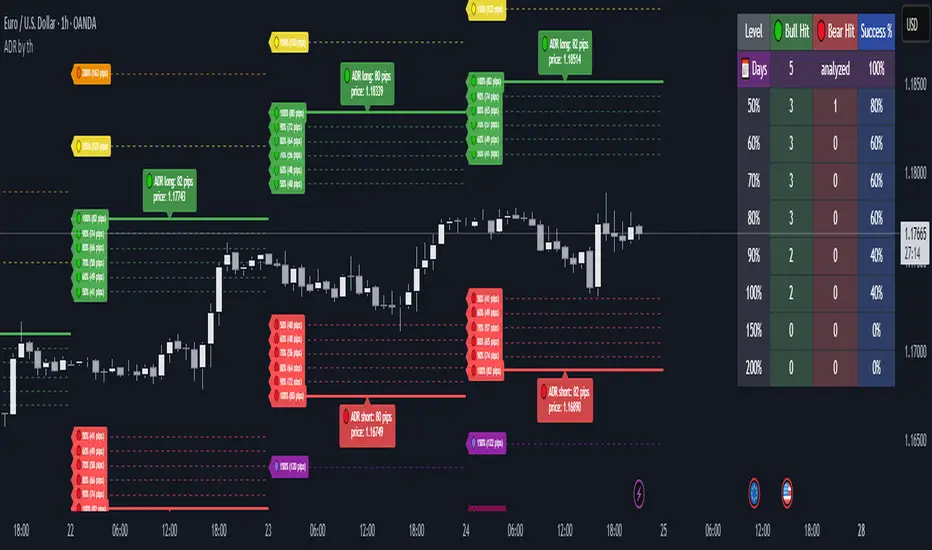
**ADR HiLo v5** is a powerful indicator for analyzing Average Daily Range that helps traders identify potential support and resistance levels based on historical volatility data.
## 🎯 Key Features
### 📈 ADR Visualization
- **Upper ADR Level** (🟢) - potential target for long positions
- **Lower ADR Level** (🔴) - potential target for short positions
- Display for last N days (configurable from 1 to 100)
### 📊 ADR Percentage Levels
The indicator shows additional ADR levels with color coding:
- **50-100%**: 🟢 Green/🔴 Red (standard levels)
- **101-150%**: 🟡 Yellow/🟣 Purple (extended levels)
- **151-200%**: 🟠 Orange/🟤 Brown (extreme levels)
### 📋 Statistics Table
Shows detailed statistics for each level hit rate:
- Number of days bullish levels were reached
- Number of days bearish levels were reached
- Overall success percentage for each level
- Number of analyzed days
## ⚙️ Settings
### 🔧 Core Parameters
- **ADR Length**: Period for calculating average range (default 14)
- **Show ADR for last N days**: Number of days to display (1-100)
- **Display as forex pips**: Show range in pips for forex pairs
### 🎨 Visual Settings
- **ADR Bull/Bear Colors**: Colors for bullish/bearish levels
- **Show ADR percentage levels**: Enable/disable percentage levels
- **Percentage levels**: Customizable levels (default: 50,60,70,80,90,100,150,200)
### 📊 Statistics
- **Show statistics table**: Enable/disable statistics table
- **Statistics position**: Table position on chart
## 🎯 How to Use
### 📈 For Trading
1. **Long positions**: Look for entry points near lower ADR levels with targets at upper levels
2. **Short positions**: Look for entry points near upper ADR levels with targets at lower levels
3. **Risk management**: Use statistics to assess probability of reaching levels
### 📊 Volatility Analysis
- High percentages of 100%+ level hits indicate high volatility
- Low percentages of basic level hits may signal changing market conditions
## 🔍 Features
### ✅ Advantages
- Automatic calculation of optimal levels based on historical data
- Detailed statistics for each level
- Color coding for easy recognition of level importance
- Forex pips support for currency pairs
- Customizable parameters for different trading styles
### 🎯 Suitable for
- Intraday trading
- Scalping
- Swing trading
- Market volatility analysis
## 📝 Notes
- Indicator designed for timeframes from 1 minute to 4 hours
- Best results on active markets with high liquidity
- Recommended to use in combination with other technical analysis methods
## 🔄 Version 5
This version includes:
- Enhanced statistics with detailed analysis
- Extended percentage levels up to 200%
- Optimized performance
- Better visualization with emojis and color coding
---
*This indicator is created to help traders identify potential support/resistance levels based on average daily range. Use at your own risk.*
發行說明
Overview:This indicator visualizes the Average Daily Range (ADR) for any market—optimized for Forex but useful across all symbols. It provides powerful range and volatility insights for the last N days, including percent-level ADR extensions, auto-stats, and clean visual labels.
Key Features:
Custom ADR Period:
Choose the length (default: 14 days) for your ADR calculation, adapting to your trading style.
ADR Levels & Labels:
Plots daily ADR high/low levels above and below each daily open. Each range is clearly marked with price and pip values for rapid decision-making.
Percentage Extensions:
See instantly where price extends to key ADR percentage levels (configurable, default: 50%, 60%, 70%, 80%, 90%, 100%, 150%, 200%), with color-coded lines and emoji labels for visual clarity.
Forex Pip Display:
Optionally view ADR and level distances in Forex pips for easier FX trading analysis.
Statistical Table:
Built-in stats table shows the number and rate of "hits" for each ADR percent extension, both bullish and bearish, so you can spot historical breakouts and overextensions at a glance.
Customizable Look & Feel:
Set colors for bull/bear ranges, move the stats table to any corner, and select how many days back you want to visualize—all from the settings panel.
How to Use:
Apply to Any Chart/TF:
Works best on intraday charts (15m, 30m, 1h) but can be used on any timeframe for context.
Levels and Entries:
Use the plotted ADR and percent levels as dynamic support/resistance, mean reversion, or breakout targets. The pip and price readouts simplify position sizing and risk management.
Range Expansion Awareness:
Spot overextended days or probable exhaustion points using the colored levels and historical statistics.
Who Is This For?
Day Traders & Scalpers:
Instantly know how much the market has moved vs. normal, and when it's statistically stretched.
Swing & Range Traders:
Identify prime reversal or fade zones based on historic range probabilities.
FX Traders:
Built-in pip mode and fine-tuned for Forex pairs.
Tips:
- The indicator auto-cleans previous drawings/labels for a tidy chart.
- You can fully adjust which ADR percentage levels are shown in the settings.
- The statistics table gives you real quantitative edge, not just visual cues.
受保護腳本
此腳本以閉源形式發佈。 不過,您可以自由使用,沒有任何限制 — 點擊此處了解更多。
免責聲明
這些資訊和出版物並非旨在提供,也不構成TradingView提供或認可的任何形式的財務、投資、交易或其他類型的建議或推薦。請閱讀使用條款以了解更多資訊。
受保護腳本
此腳本以閉源形式發佈。 不過,您可以自由使用,沒有任何限制 — 點擊此處了解更多。
免責聲明
這些資訊和出版物並非旨在提供,也不構成TradingView提供或認可的任何形式的財務、投資、交易或其他類型的建議或推薦。請閱讀使用條款以了解更多資訊。