OPEN-SOURCE SCRIPT
Normalized Volatility
OVERVIEW
The Normalized Volatility indicator is a technical indicator that gauges the amount of volatility currently present in the market, relative to the average volatility in the market. The purpose of this indicator is to filter out with-trend signals during ranging/non-trending/consolidating conditions.
CONCEPTS
This indicator assists traders in capitalizing on the assumption that trends are more likely to start during periods of high volatility compared to periods of low volatility. This is because high volatility indicates that there are bigger players currently in the market, which is necessary to begin a sustained trending move.
So, to determine whether the current volatility is "high", it is compared to an average volatility for however number of candles back the user specifies.
If the current volatility is greater than the average volatility, it is reasonable to assume we are in a high-volatility period. Thus, this is the ideal time to enter a trending trade due to the assumption that trends are more likely to start during these high-volatility periods.
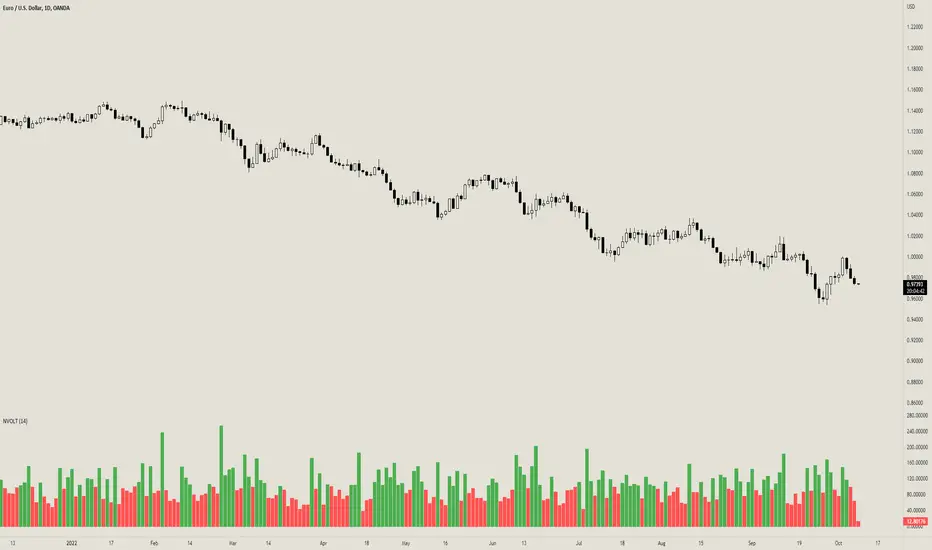
HOW DO I READ THIS INDICATOR
When the column's color is red, don't take any trend trades since the current volatility is less than the average volatility experienced in the market.
When the column's color is green, take all valid with-trend trades since the current volatility is greater than the average volatility experienced in the market.
The Normalized Volatility indicator is a technical indicator that gauges the amount of volatility currently present in the market, relative to the average volatility in the market. The purpose of this indicator is to filter out with-trend signals during ranging/non-trending/consolidating conditions.
CONCEPTS
This indicator assists traders in capitalizing on the assumption that trends are more likely to start during periods of high volatility compared to periods of low volatility. This is because high volatility indicates that there are bigger players currently in the market, which is necessary to begin a sustained trending move.
So, to determine whether the current volatility is "high", it is compared to an average volatility for however number of candles back the user specifies.
If the current volatility is greater than the average volatility, it is reasonable to assume we are in a high-volatility period. Thus, this is the ideal time to enter a trending trade due to the assumption that trends are more likely to start during these high-volatility periods.
HOW DO I READ THIS INDICATOR
When the column's color is red, don't take any trend trades since the current volatility is less than the average volatility experienced in the market.
When the column's color is green, take all valid with-trend trades since the current volatility is greater than the average volatility experienced in the market.
開源腳本
秉持TradingView一貫精神,這個腳本的創作者將其設為開源,以便交易者檢視並驗證其功能。向作者致敬!您可以免費使用此腳本,但請注意,重新發佈代碼需遵守我們的社群規範。
免責聲明
這些資訊和出版物並非旨在提供,也不構成TradingView提供或認可的任何形式的財務、投資、交易或其他類型的建議或推薦。請閱讀使用條款以了解更多資訊。
免責聲明
這些資訊和出版物並非旨在提供,也不構成TradingView提供或認可的任何形式的財務、投資、交易或其他類型的建議或推薦。請閱讀使用條款以了解更多資訊。