OPEN-SOURCE SCRIPT
已更新 Bullseye PDHL
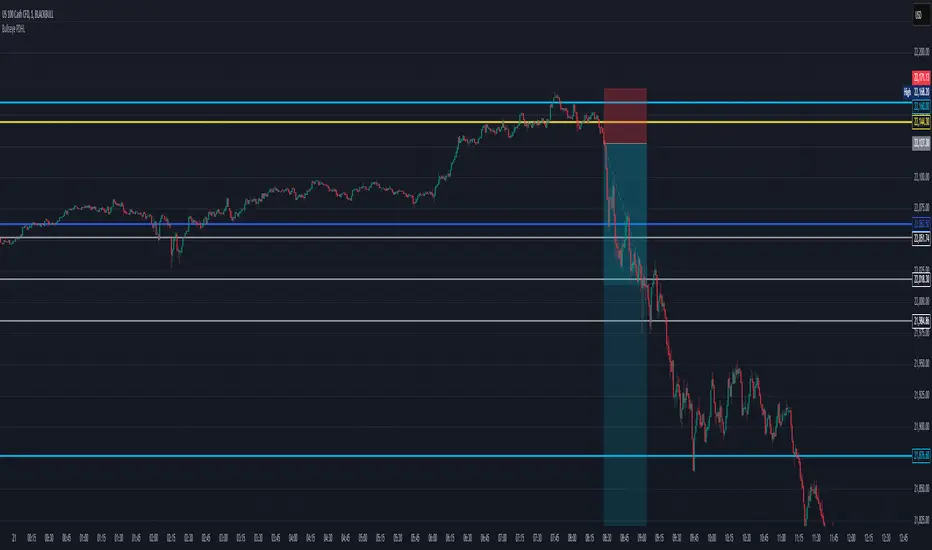
Bullseye PDHL Indicator
The Bullseye PDHL indicator is designed for traders who want to visually identify key price levels from the previous trading day, including the high, low, and significant Fibonacci retracement levels. This indicator helps traders understand potential support and resistance zones, which can be useful for planning entries and exits.
Key Features:
Previous Day’s High and Low:
Plots the previous day’s high and low as solid lines on the chart to easily identify important levels from the prior session.
These levels serve as critical support and resistance markers, which are often respected by the market.
Fibonacci Retracement Levels:
Plots three Fibonacci retracement levels (38.2%, 50%, and 61.8%) between the previous day’s high and low.
These levels are key reference points for assessing potential pullbacks or retracements during the current trading day.
Visual Representation:
The previous day’s high and low are plotted in cyan for easy differentiation.
The Fibonacci retracement levels (30%, 50%, 60%) are plotted in white, providing a clear visual reference for traders.
This indicator can help traders identify important reaction zones and areas where price might reverse or consolidate, making it a valuable addition for technical analysis.
發行說明
Cool Update to Bullseye PDHL on TradingView!Hey traders! 🚀 Check out the latest tweak to the Bullseye PDHL indicator—it's now got neat switches to show or hide yesterday's open and close prices right on your charts. Customize your view, keep your charts slick, and make analyzing those price moves easier than ever! Jump into your next trade with style with the new Bullseye PDHL!
開源腳本
秉持TradingView一貫精神,這個腳本的創作者將其設為開源,以便交易者檢視並驗證其功能。向作者致敬!您可以免費使用此腳本,但請注意,重新發佈代碼需遵守我們的社群規範。
免責聲明
這些資訊和出版物並非旨在提供,也不構成TradingView提供或認可的任何形式的財務、投資、交易或其他類型的建議或推薦。請閱讀使用條款以了解更多資訊。
開源腳本
秉持TradingView一貫精神,這個腳本的創作者將其設為開源,以便交易者檢視並驗證其功能。向作者致敬!您可以免費使用此腳本,但請注意,重新發佈代碼需遵守我們的社群規範。
免責聲明
這些資訊和出版物並非旨在提供,也不構成TradingView提供或認可的任何形式的財務、投資、交易或其他類型的建議或推薦。請閱讀使用條款以了解更多資訊。